

Everyone is Missing the Point about the Fed's Rate Cuts in 2024
What is the point, what does it mean, and what can we expect? - Article #17

In this 13 min article, The X Project will answer these questions:
I. Why this article now?
II. What do you need to know about the US Treasury market?
III. What happened on July 31 and August 1 of 2023?
IV. How did the markets react?
V. Why did the markets react that way?
VI. What happened in October, what is the MOVE index, and why is it significant?
VII. What did the FED and US Treasury do about the MOVE Index spike in October?
VIII. And then what happened in November and December?
IX. What does The X Project Guy have to say?
X. Why should you care?
I. Why this article now?
This article is about one of the most crucial points that drove The X Project into existence. It is also relatively complicated, so much in this article will be broken down later and revisited. But given last week’s Fed announcement that rate cuts are coming in 2024 and the flurry of news, commentaries, and articles about it that all missed the point, The X Project needed to point out what is driving the Fed’s actions and decisions, what it means, and what we can expect.
But to explain what is driving the Fed’s actions and decisions, we need to cover some basics and then go back a few months…
II. What do you need to know about the US Treasury market?
The US Treasury market is the most important and foundational aspect of our entire global financial system, which is often described as the world's largest, deepest, and most liquid market for securities. U.S. Treasuries are viewed as highly safe assets due to the creditworthiness of the U.S. government, contributing to their widespread use as high-quality collateral in various financial transactions. This perceived safety and the market's size and liquidity make U.S. Treasuries crucial in the global financial system, underpinning many other financial activities and markets.
However, the perceived safety of US Treasurys has been under fire. Three primary credit rating agencies are designated as Nationally Recognized Statistical Rating Agencies (NRSRO) by the US Securities and Exchange Commission (SEC). You may recall the shock Standard and Poor’s (S&P) gave markets when it downgraded the US credit rating from AAA to AA+ in August 2011. Back then, S&P considered the government budget deficit of more than 11% of GDP and net government debt rising to approximately 80% of GDP by 2013 to be high relative to other AAA-rated countries.
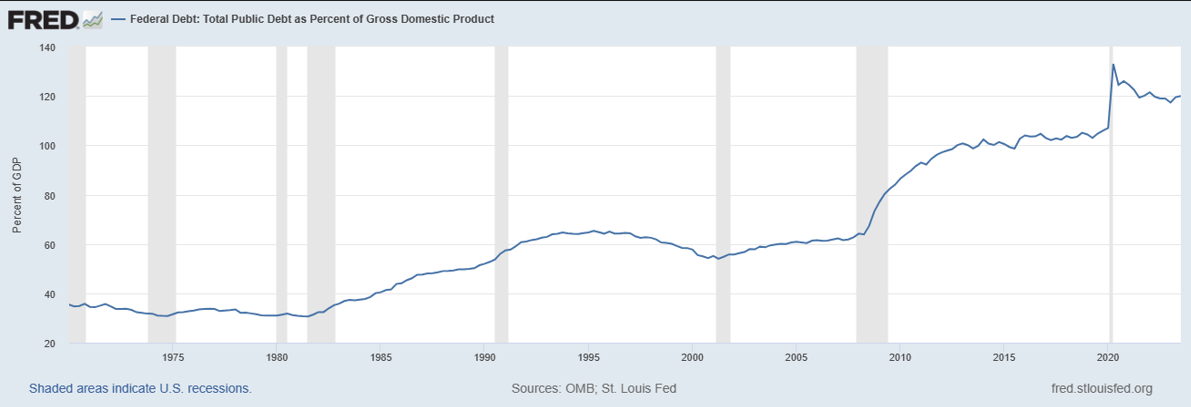
Today, the US government deficit to GDP ratio has come down to a little more than 5%.

However, the total debt to GDP ratio is 120%.
III. What happened on July 31 and August 1 of 2023?
On July 31 of this year, the US Treasury announced that it expected to borrow $1.007 trillion in the July-September quarter and $852 billion in the October-December quarter. That is a staggering, breathtaking, eye-watering, can’t-be-superfluous-enough, $1.859 trillion in 6 months at a time when the economy is supposedly robust, and unemployment is near record lows!?!
Right on cue, on August 1, Fitch Ratings became the second agency to downgrade the US long-term credit rating from the highest AAA to a notch lower at AA+.
Notwithstanding, no one thinks there is any real risk of the US defaulting on its debt by not making a coupon payment or failing to repay the bond principal. The real danger is of a “soft” default whereby the US meets its nominal debt obligations but effectively reduces the real value of its debt through inflation. In such a case, while the government does not technically default on its debt, the purchasing power of the money paid back to investors is eroded due to high inflation. This situation can be considered an indirect or "soft" default, as it diminishes the real returns for investors holding US Treasuries.
IV. How did the markets react?
Here is a summary of how the markets reacted over the next couple of months to the US Treasury’s funding announcement and Fitch Ratings’ downgrade.
The US Dollar Index (DXY) rose 5.1% between July 31 and October 3
The US 10-year Treasury yield increased from 4.05% on July 31 to a high of 4.99% on October 18
The iShares 20 Plus Year Treasury Bond ETF (TLT) fell 17.3% between July 31 and October 19
The S&P 500 fell 10.3% between July 31 and October 27.
V. Why did the markets react that way?
A simple explanation for why the markets reacted this way is that the US Treasury announced it would issue a massive supply of bonds (and notes and bills) to the market, and this…
is likely to “crowd out” the market for US Dollars as so many dollars will go to buy the enormous supply of US Treasurys, and thus, US Dollars become more scarce, and their price relative to other currencies goes up;
is likely to overwhelm the demand for US Treasurys with supply, thus causing bond prices to fall and bond yields to rise;
is likely to cause yields to rise, which puts downward pressure on equity prices because the cost of borrowing money is higher (less money to invest back into the company and less cash flow stability), and the future discounted valuations are lower as the discount rate used for future cash flow is higher.
Furthermore (and again, very simplified), as US Dollar markets get “crowded out” by the increasing supply of US Treasurys coming to market, demand for Dollars is increasingly satisfied by other market participants liquidating assets to raise Dollars, with those assets often being existing US Treasurys. This adds to the supply of US Treasurys in the market, which causes prices to go down or yields to increase. So, a rising US Dollar causes US Treasury yields to go up, and rising US Treasury yields cause the US Dollar to go up. Wash, rinse, and repeat until something breaks. Financial crises have been predictable outcomes countless times throughout history, as outlined in This Time is Different: Eight Centuries of Financial Folly.
VI. What happened in October, what is the MOVE index, and why is it significant?
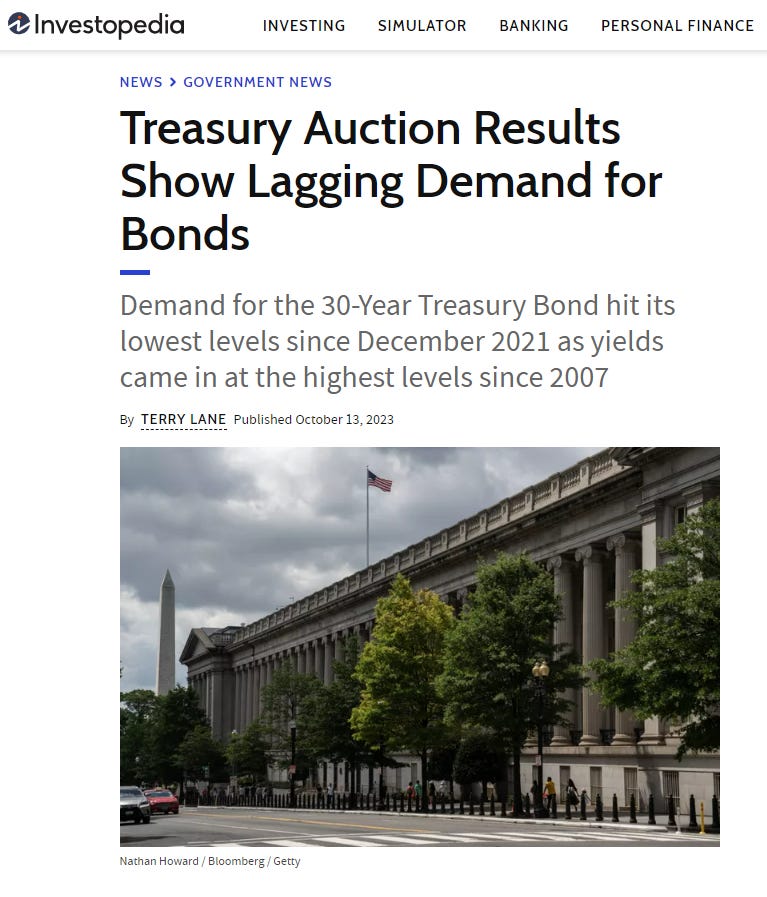
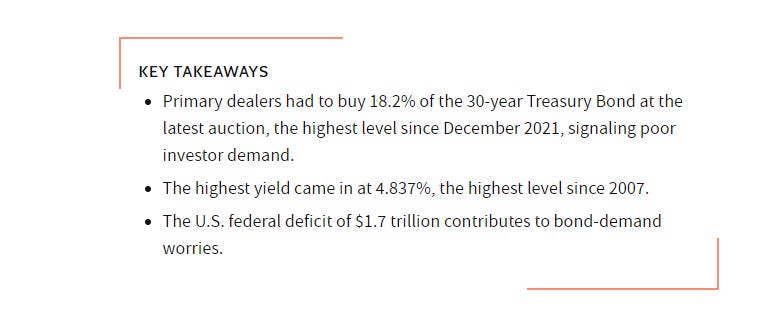
Back to wash, rinse, and repeat until something breaks… What is one of the biggest things that can break then? The US Treasury market. And what does a breaking US Treasury market look like? The 30-year Treasury Bond auction on October 12 is a good example. Here is a headline from an Investopedia article with key takeaways:
If you are interested in how US Treasury auctions work, James Lavish, CFA has an excellent thread on X/Twitter here.
Another way to see if the US Treasury market is breaking is by The Merrill Option Volatility Estimate (MOVE) Index, which measures expected short-term volatility in the US Treasury bond market. It was introduced by Harley Bassman of Merrill Lynch (now part of Bank of America) in 1994 to gauge market sentiment and predict potential price swings in the bond market. The MOVE Index calculates the implied volatility of U.S. Treasury options using a weighted average of option prices on Treasury futures across multiple maturities (2, 5, 10, and 30 years). The index is like the VIX volatility index that lets us know when volatility/uncertainty is high or low in the stock market by monitoring options contracts. Traders and investors use the MOVE Index to watch the bond market’s volatility and make informed investment decisions. Analysts also use the index to predict potential price swings in the bond market. The index is updated daily.
In early October, the MOVE index spiked above 140 (the fifth red circle at the far right).

What are the other red circles on the chart, and what is their significance? Let’s first look at the corresponding US Dollar index chart:
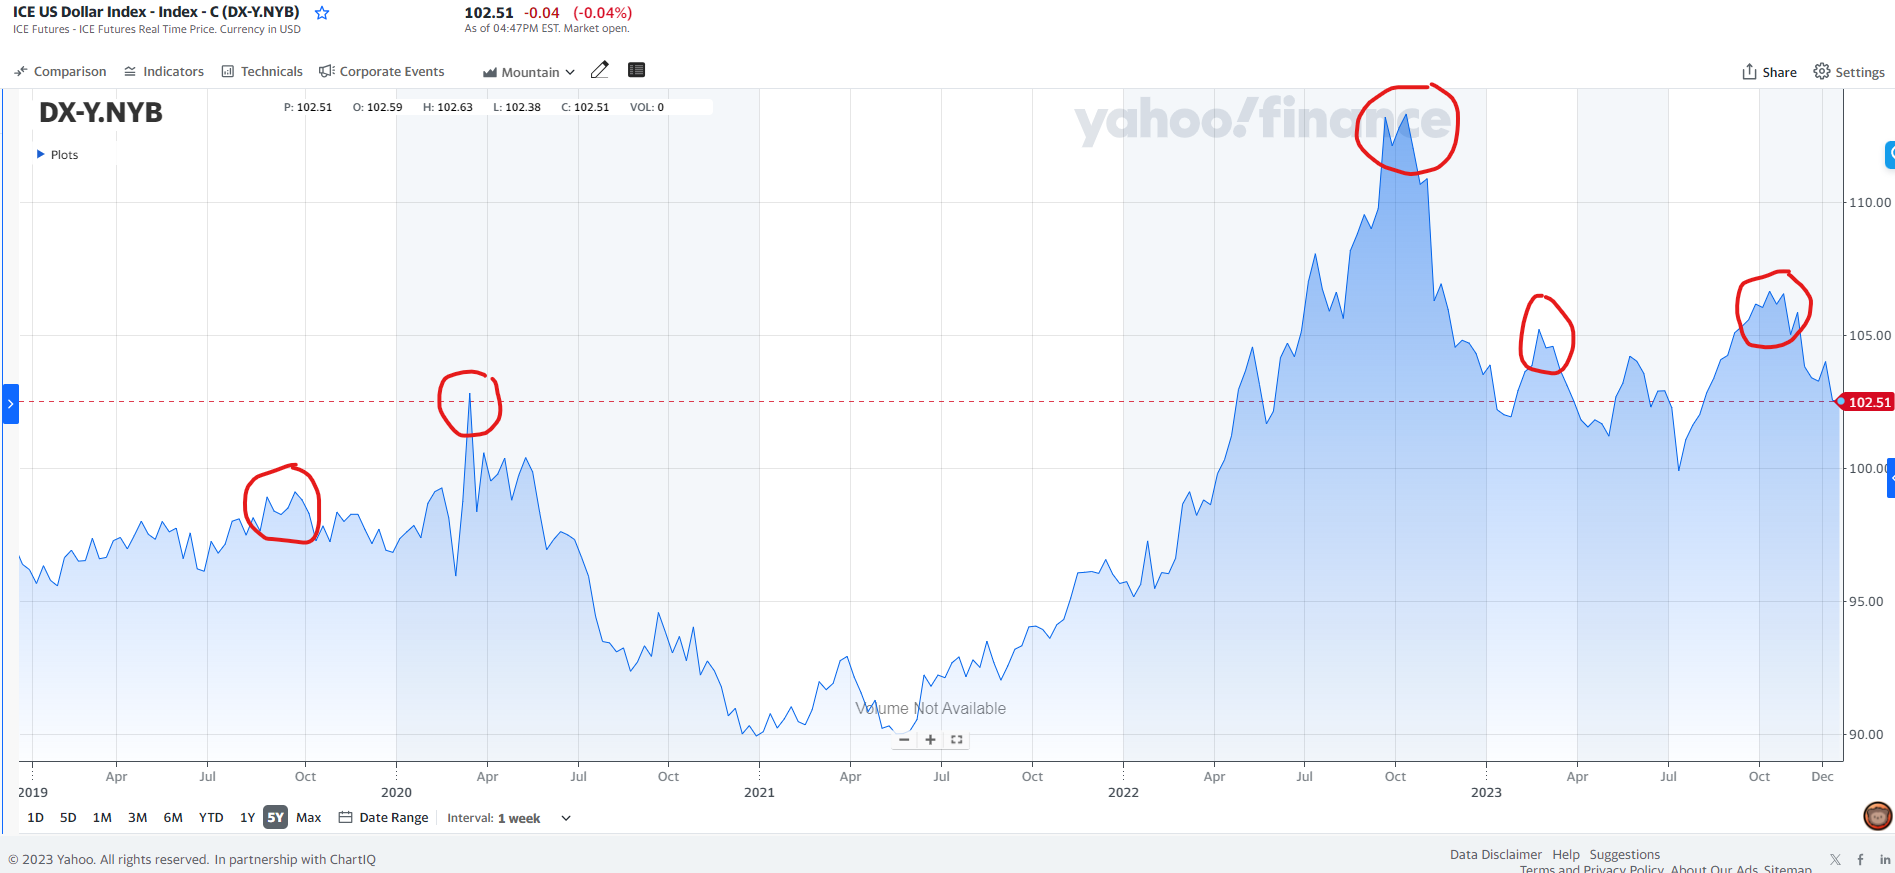
In the charts above, each circle represents a temporary top in the MOVE index (a peak in volatility or market stress/dysfunction) and a temporary top in the US Dollar index.
Why is this significant? Because of what we are constantly told, most people believe that the Fed’s dual mandate is to manage monetary policy to promote maximum employment and stable prices. But these five events prove that the Fed has yet a higher mandate that supersedes both of those based on what happened and what the Fed did:
1st red circle = September 2019 overnight repo market rate spike caused by a temporary shortage of cash available in the financial system because of the deadline for quarterly corporate taxes and the issuance of new US Treasurys. To stabilize the repo market, the Fed injected several hundred billion dollars of liquidity into the repo markets and lowered the interest paid on bank reserves.
2nd red circle = March 2020, the Covid lockdown and market panic. The US 10-year Treasury yield surged sharply by 65 basis points from March 9 to March 18 while the stock market kept falling. In the past, when there was a risk-off event, capital fled to and took refuge in the US Treasury market, causing prices to go up and yields to fall. But this time, there was such an urgent need for liquidity that the opposite happened, and the Fed had to step in with massive purchases of over $1 trillion of US Treasurys.
3rd red circle = October 2022, the US Dollar Index surged to 114, the highest level in 20 years, while the US 10-year Treasury yield climbed above 4% to 4.2% for the first time since 2007. Despite the Federal Reserve still aggressively hiking rates by 75 basis points in September 2022 and again by 75 basis points in November 2022 and maintaining quantitative tightening during this period, the US Treasury managed to supply a little over $100 billion per month in liquidity from October through December by running down the US Treasurys General Account (TGA).
4th red circle = March 2023, Signature Bank and Silicon Valley Bank failed the most significant US bank failures since 2008. The Federal Reserve created and launched an emergency lending program called the Bank Term Funding Program (BTFP) to provide emergency liquidity to US depository institutions by offering loans of up to one year in length to US banks, savings associations, credit unions, and other eligible depository institutions that pledge U.S. Treasuries, agency debt, mortgage-backed securities (MBS), and other qualifying assets as collateral receiving par value for the collateral instead of the much-reduced market value of the securities.
By the way, the “emergency” need for this funding program continues growing and is now at $123.76 billion:


VII. What did the FED and US Treasury do about the MOVE Index spike in October?
To start with, in nine trading days between September 29 and October 11, seven Federal Reserve speakers gave speeches saying something to the effect that the bond market has been doing a lot of the tightening work for the Fed recently. That was good enough for the US Dollar index to peak at 107 on October 3, for the US 10-year Treasury yield to peak at 4.99% on October 18, for TLT to put in a low of 82.77 on October 19, and for S&P 500 Index to put in a low of 4117 on October 27.
Then, on October 30, the US Treasury announced it expected to borrow only $776 billion in the October - December quarter, down from $852 billion expected on the July 31 announcement. The US Treasury also announced it expected to borrow $816 billion in the January - March quarter. While these are still huge numbers, they were slightly better than the announcement the quarter before and slightly better than expected, so the markets were relieved.
Finally, on November 1, the US Treasury released the Treasury Borrowing Advisory Committee (TBAC) reports and recommendations. And there were three overarching takeaways. The first is the conclusion that the long end of the yield curve is not nearly as deep and liquid as everyone thinks. The second conclusion is that the largest marginal buyers of US Treasurys since 2021 have been highly leveraged hedge funds participating in the “basis trade,” where they profit on the slight difference in prices and yields when buying cash US Treasurys and selling US Treasury futures with 50x-500x leverage. The US Treasury needs someone to buy its debt, even if it means accepting the systemic risk that comes with the enormous amount of leverage being used. The third takeaway was the TBAC’s recommendation: “The Committee supported meaningful deviation from the historical recommendation for 15-20% T-Bill share.” In acknowledgment of the long end of the curve not being liquid enough, the US Treasury needs to shift its debt issuance toward the short end of the yield curve, including significantly more than 20% of the debt issued in short-term bills.
VIII. And then what happened in November and December?
First, the good news as far as the markets are concerned is that November saw the most significant easing in financial conditions in any single month in the past four decades, according to the Goldman Sachs US Financial Conditions Index:

US bonds had their best month since May 1985. The US Treasury running down the TGA by $100-$150 billion in November certainly helped, and it was no surprise everything went up (gold, BTC, equities, & bonds) except the dollar (and oil, which is another story).
However, there was some bad news on November 9th, reinforcing the TBAC’s recommendation:

And then, by early December, it became known that November’s US True Interest Expense (Social Security + Medicare + Medicaid + Interest Expense) was $345 billion vs. tax receipts of $275 billion.
IX. What does The X Project Guy have to say?
First, I know I have presented an overly simplified explanation of everything so far, and there are many layers and branches of additional information regarding most of what I have shared. Still, I needed to get this all into one article, which was difficult.
Secondly, I must give a big hat tip and bow to Luke Gromen at FFTT, LLC. What I have shared with you is primarily distilled from at least a dozen Tree Rings reports.
Let’s wrap this up and get back to the point driving the Fed’s actions and decisions, what it means, and what you should expect. The US fiscal position is forcing the Fed to stop hiking and will be forcing the Fed to cut rates before inflation is back down to its targets. I wrote an earlier article introducing the concept, but this is what FISCAL DOMINANCE is.
The Fed had a choice to continue fighting its fight against inflation, but that would sacrifice the US Treasury market, which would spike yields to extremely high levels, which would send the US Dollar to the moon, and which would crash the economy, creating a financial crisis along the way. Inflation would be killed, deflation would be rampant, the US Dollar would be very strong, and we would suffer a deep and prolonged economic depression.
Instead, the Fed decided to save the US Treasury market. You should expect the US Dollar to weaken in the short run (3-6 months, perhaps through next year’s presidential election). This will drive US asset prices higher, GDP growth higher, US Tax receipts higher, and US Treasury yields lower, as that should all help reduce the amount of US Treasury issuance.
X. Why should you care?
You should care because what the Fed is doing will eventually bring back inflation that will be much worse than the last wave. The short-run won’t last long because we are in Fiscal Dominance. After all, it is unlikely that we will close our budget deficits, and it is doubtful that tax receipts will get above our true interest expense.
In the long run, the best-case scenario from here is inflation runs hot (without hyperinflating) for many years until our debt-GDP ratio is back down to a manageable level. Unfortunately, we live in a hyper-financialized, highly leveraged world. So, the risk of a financial crisis erupting and crashing the financial system and economy is ever-present and uncomfortably high.
This is why The X Project exists, to help you know what you need to know. Please support The X Project in continuing its mission.
Please hit the heart icon indicating you like this article
Please share this article (and prior articles) with anyone and everyone you know and care about.
Please consider a paid subscription. Until the end of the year, all paid subscriptions come with a free 60-day trial, and you can cancel at any time. Every month, for the cost of two cups of coffee, The X Project will deliver ten articles per month ($1 per article), helping you know in 1-2 hours what you need to know about our changing world at the intersection of commodities, demographics, economics, energy, geopolitics, government debt & deficits, interest rates, markets, and money.
If you see value in the articles published so far and in the mission of The X Project, please be generous and aggressive in referring friends. Click the link to see the rewards where you can earn free paid subscriptions as well as the link to use for making referrals.
And if you have not already done so, please at least subscribe for free.
Great article, learned alot.