


Has the Capital Rotation Event Has Arrived?
Are your ready for something similar to 1930, 1972 and 2002? - Article #108

In this 12-minute article, The X Project will answer these questions:
I. Why this article now?
II. What is the problem with pricing in dollars?
III. How does NASDAQ look priced in gold?
IV. What is the Ichimoku Cloud?
V. How might NASDAQ play out over the next couple of years?
VI. What does the “Capital Rotation Indicator” say, and what does it mean for the S&P 500?
VII. What does gold versus the S&P 500 tell us?
VIII. What can we expect from gold if we have a convincing close above the CRE line?
IX. What does The X Project Guy have to say?
X. Why should you care?
Reminder for readers and listeners: nothing The X Project writes or says should be considered investment advice or recommendations to buy or sell securities or investment products. Everything written and said is for informational purposes only, and you should do your own research and due diligence. It would be best to discuss with an investment advisor before making any investments or changes to your investments based on any information provided by The X Project.
I. Why this article now?
In my article two weeks ago, I mentioned that my next article would be this one. However, I felt compelled last week to go in a different direction. And so now it’s time to deliver on that overdue promise.
Before you continue, I highly encourage you to re-read two articles (click on the light blue title to access them). The first is foundational: “Priced in Gold: Looking at inflation, the dollar, and the world from a different perspective.” The second is the original “Capital Rotation” article: “CAPITAL ROTATION: A visual article of X posts and charts from the guys at Northstarbadcharts.com.”
II. What is the problem with pricing in dollars?
In case you did not read or re-read the first article above, let me share at least this one crucial point from it:
It is the same problem I just stated.
Since 1924, the US Dollar has lost 95% of its purchasing power
Since 1974, the US Dollar has lost 85% of its purchasing power
Since 1999, the US Dollar has lost 48% of its purchasing power
Since 2014, the US Dollar has lost 26% of its purchasing power
Since 2019, the US Dollar has lost 20% of its purchasing power
Do you see the problem? We are earning, saving, and investing in a currency that has been and is losing value. It will continue to do so, and I believe at a faster average rate over the next decade or two than we’ve experienced in the past several decades.
We are pricing things in a currency that has been and will continue to lose its value. If I compare the price of something today with the price of that same thing at some point in the past, I am not comparing two variables but actually four variables. The dollar is not constant across time. As I illustrated, quantified, and said in the section above, inflation means that a dollar today is worth more now than it will be in the future, and a dollar today is worth less than it was in the past. Is the S&P 500 at all-time highs? Or is the U.S. Dollar’s purchasing power at all-time lows? Can both be true? These are good questions that we will consider in the next section.
This problem is why you sometimes see historical price charts “adjusted for inflation.” The problem with adjusting for inflation is that inflation is a moving target, with the official calculation changing over time.
The third point of this article is that there is another way to look at prices, and that is to look at things priced in gold. Gold is considered an ancient form of money that has held its value over time. For instance, an old saying is that an ounce of gold can always buy a nice tailored men’s suit. This was true in 1935, when gold was $35 per ounce, and it is true today.
The problem with pricing things in gold is that the calculation requires the price of gold in dollars, which is volatile over time. Nonetheless, looking at things priced in gold, especially over more extended time frames, can provide a different and meaningful perspective on the value of that thing...
III. How does NASDAQ look priced in gold?
The charts from the guys at northstarbadcharts.com in the following sections contain much information. Please spend some time studying them carefully. This one was originally posted here: https://x.com/NorthstarCharts/status/1909729332290895893

Note that the chart above is a monthly chart, and the month is not over. Where we close at the end of the month will be critical.
IV. What is the Ichimoku Cloud?
According to Investopedia,
The Ichimoku Cloud offers a comprehensive view of the market, including the trend's direction and momentum (when the market is trending), as well as likely support and resistance levels. Because it is so comprehensive, the Cloud filters out a lot of noise, making it more appropriate for trend-following or trend trading than short-term moves. Unlike most indicators, particularly moving averages, the Cloud offers a forward-looking view of the market as well as a backward-looking one, helping traders spot potential trend continuation moves or reversals in advance.
The Cloud works best in trending markets and is much less effective in periods of sideways consolidation. When prices are above the cloud, the market is in an uptrend; when prices are below the cloud, the market is in a downtrend; and when prices are in the cloud, the market is in a sideways trend or consolidating.
V. How might NASDAQ play out over the next couple of years?
This was originally posted here, and shows a potential analog of the NASDAQ from 2000-2002 and 2024-2026:

VI. What does the “Capital Rotation Indicator” say, and what does it mean for the S&P 500?
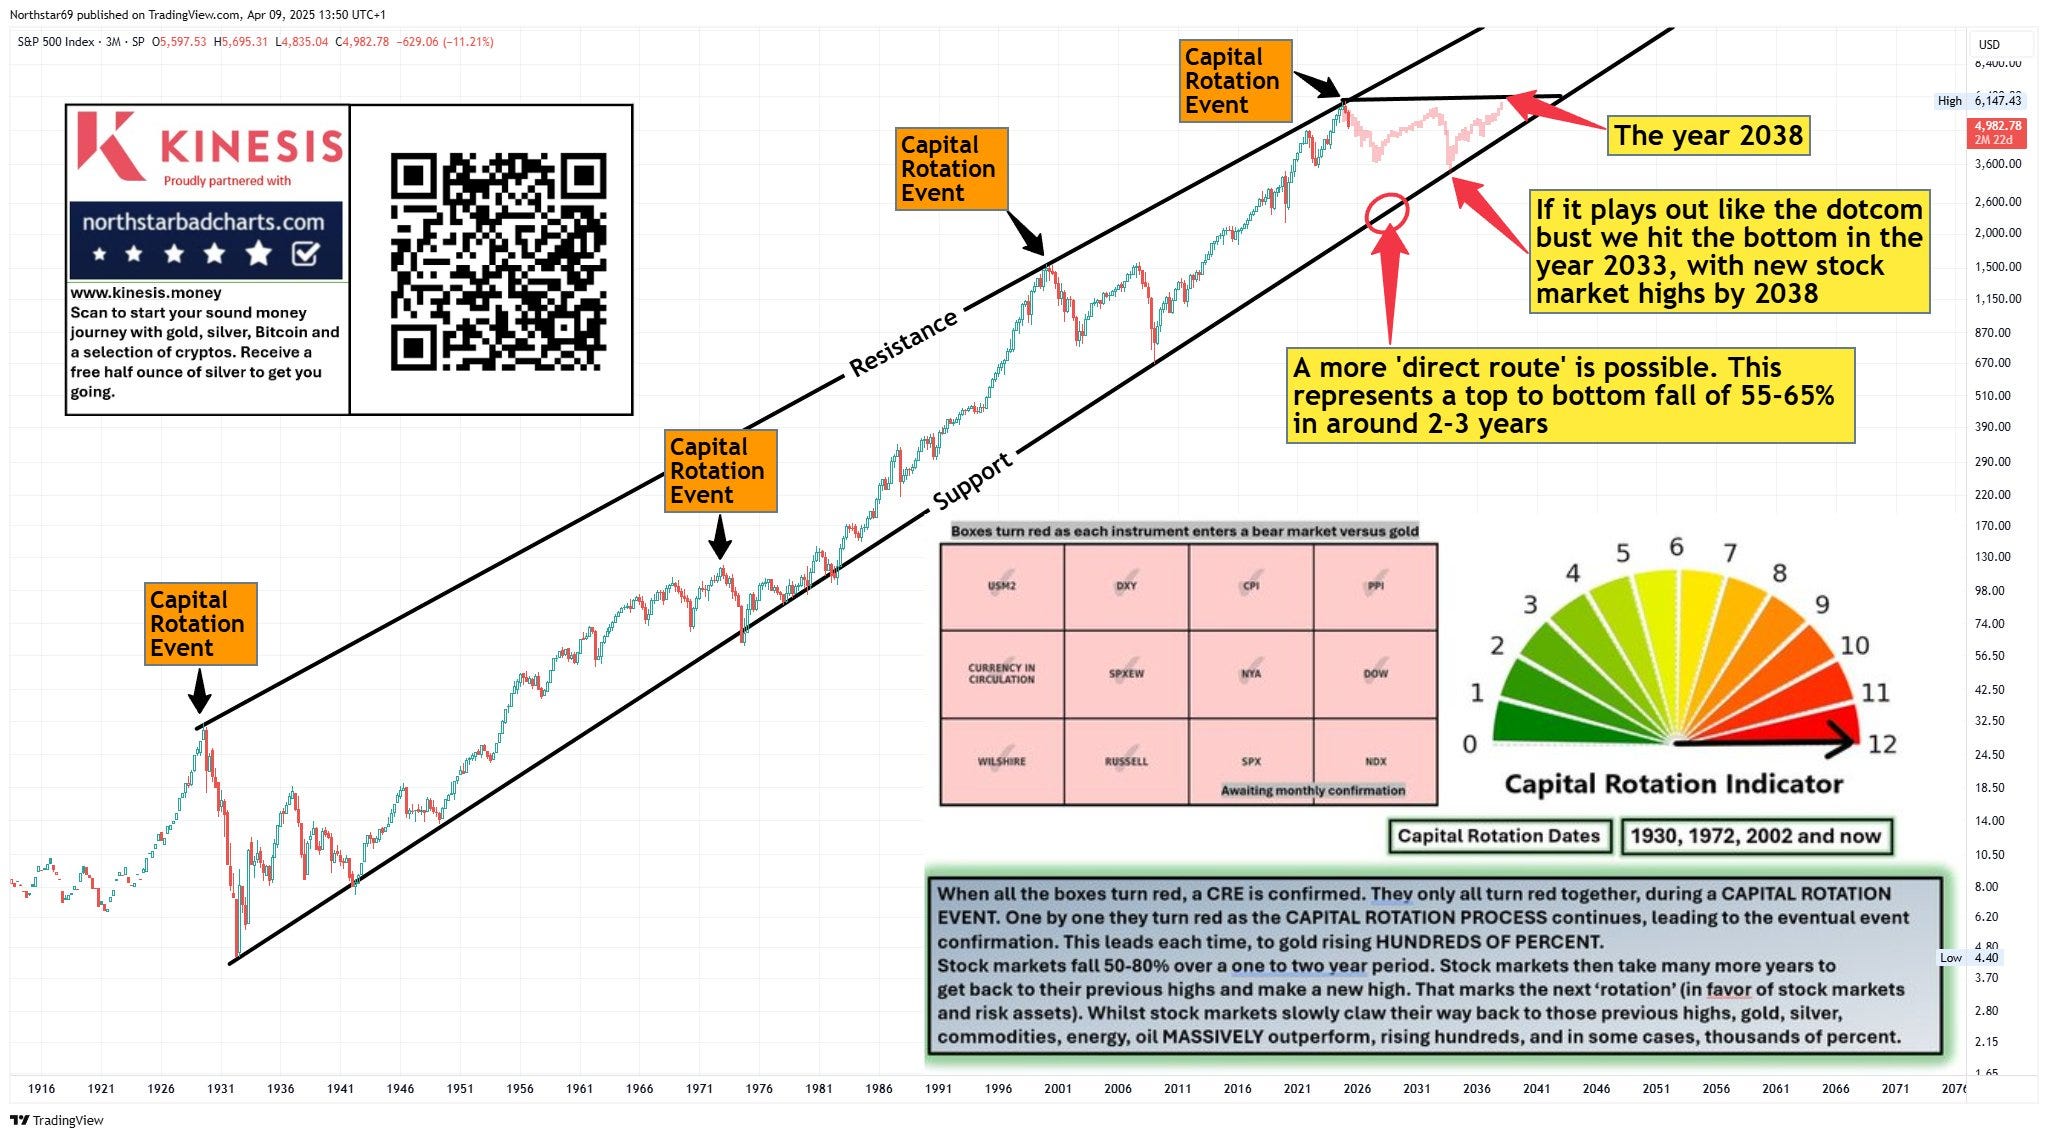
NDX and SPX await monthly confirmation, but the ten other indices and economic indicators priced in gold are already in a bear market according to northstarbadcharts.com’s Capital Rotation Indicator:

This is the fourth capital rotation event in one hundred years. Reread the box above to understand what happened in the previous three.
Here is a graphical representation of what we can expect from the S&P 500:
VII. What does gold versus the S&P 500 tell us?
Here is a very detailed analysis with the price flipped and looking at the gold to S&P 500 ratio:
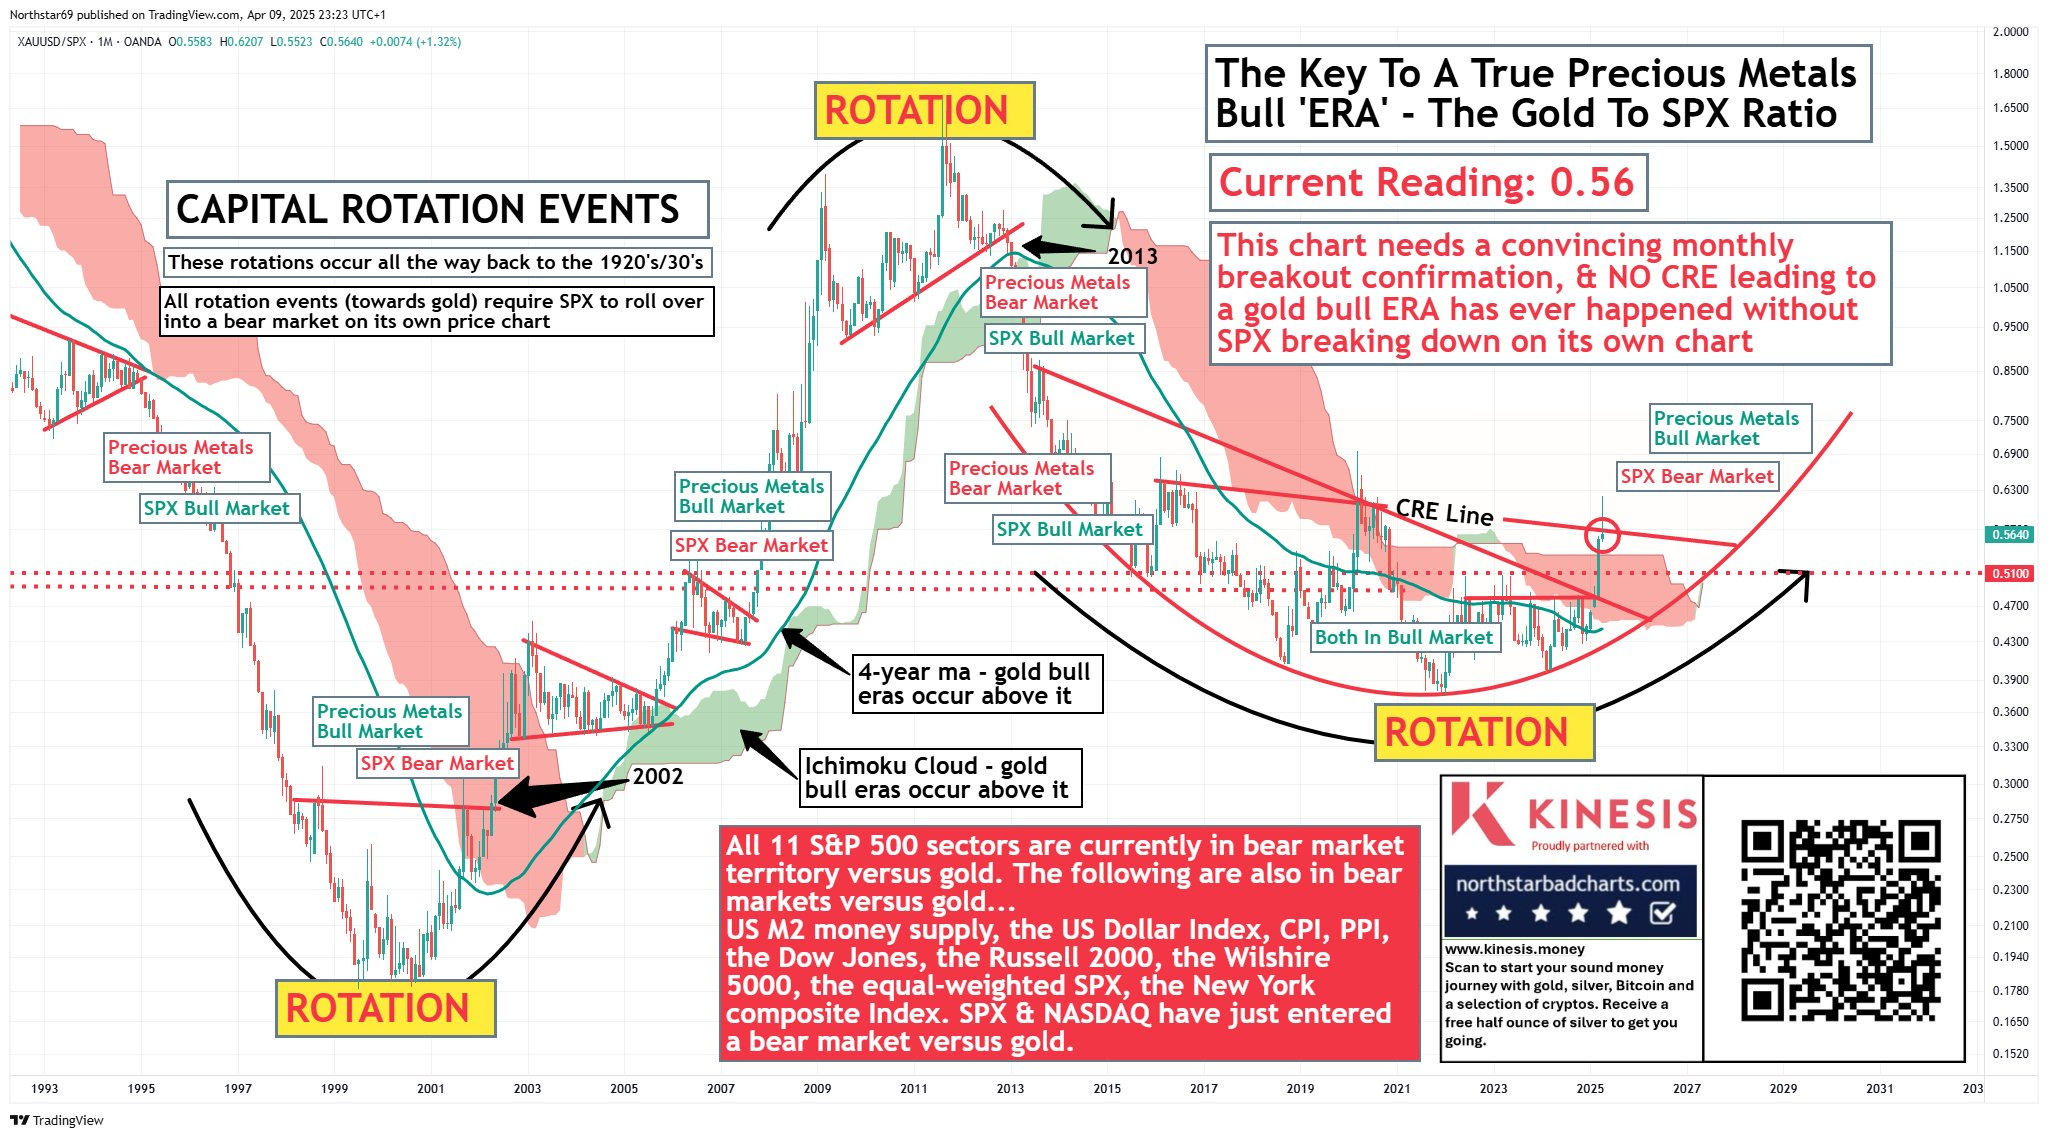
We are right at the CRE line with half a month to go before we close the current bar on the chart.
VIII. What can we expect from gold if we have a convincing close above the CRE line?
The guys at northstarbadcharts.com expect gold prices to reach $8,000 to $12,000 (or more) per ounce by the end of the decade. However, in the short run, they see a quick move up to $3,300 - $3,600 per ounce and then a multi-month pull-back to $2,700 - $2,900.

IX. What does The X Project Guy have to say?
Based on the analysis above, I will likely buy put options to hedge my gold position when it reaches $3,300+. I will then cash in that insurance if and when gold drops below $3,000, using the proceeds to buy more gold.
I suspect the pullback in gold could coincide with sharper and more significant declines in the stock market. I intend to buy some put options on the S&P 500 in the 5,500 to 5,700 range and the NASDAQ 100 in the 19,000 to 20,000 range.
Of course, that is what I think today, and I could easily change my mind. But overall, I believe that the stock market is far more likely to make new lows before new highs. Therefore, if I am correct, I am looking for opportunities to express that thesis and capitalize on it.
I will not sell any of my gold positions. However, I expect significant price drops that could be prolonged, so I will occasionally buy insurance to generate cash and buy more gold at better entry points after extended moves.
Finally, gold could move down in price along with the stock market, but as long as the stock market moves down with bigger percentage losses than gold, the capital rotation event thesis is not only intact but strengthened.
X. Why should you care?
If most of your wealth is tied up in the stock market, your net worth may have reached a nominal high-water mark. If you do nothing, you may see your net worth reduced by half or more, and it may take a decade or more before you reach that nominal high-water mark again. Of course, by that time, I expect that the U.S. dollar will have lost a significant amount of its purchasing power, so you will still be far behind where you are today.
Depending on how you are positioned, this capital rotation event could set you back financially so much that you never recover. Or it could set you free.
Thank you for your subscription, especially if you are a paying subscriber. Your support is everything to The X Project and is greatly appreciated. If you agree, please do me the favor of hitting the like button and posting positive comments about my articles - assuming you have positive things to say.
The important thing is that the CREs are linked to major financial, social, geopolitical changes, etc. And another thing that is striking is that events such as GFC and COVID were only consequences (GFC) or preludes (COVID) of major changes. I liked it a lot the ichimoku cloud and the technical analisys in the substack is pretty consistent.