The Dollar and Other Financial Markets are on the MOVE!
Examining recent market moves, correlations, and breakdowns - Article #89
In this 14-minute article, The X Project will answer these questions:
I. Why this article now?
II. What has the Dollar been doing?
III. Which foreign currencies are weakening the most against the Dollar?
IV. What has been happening with U.S. bond yields and prices?
V. What about U.S. bond market volatility?
VI. What does this all mean for equities?
VII. What about gold prices?
VIII. What is being said about various correlations?
IX. What does The X Project Guy have to say?
X. Why should you care?
Reminder for readers and listeners: nothing The X Project writes or says should be considered investment advice or recommendations to buy or sell securities or investment products. Everything written and said is for informational purposes only, and you should do your own research and due diligence. It would be best to discuss with an investment advisor before making any investments or changes to your investments based on any information provided by The X Project.
I. Why this article now?
Financial markets have been interesting the last couple of weeks, both because of their individual movements and more so because of the correlations or breakdowns. To provide context to this article, you may want to review the following articles:
What's Going on with Currencies These Days? An Introductory Primer to Foreign Exchange Markets
Currency Crash Round-Up: What can Forex market moves tell us about what's happening?
And if you only re-read one article, it should be this one:
The U.S. dollar (USD) first grabbed my attention and prompted this article. But as I looked further into what was happening, I found more to the story, which I’ll try to convey in this article.
II. What has the Dollar been doing?
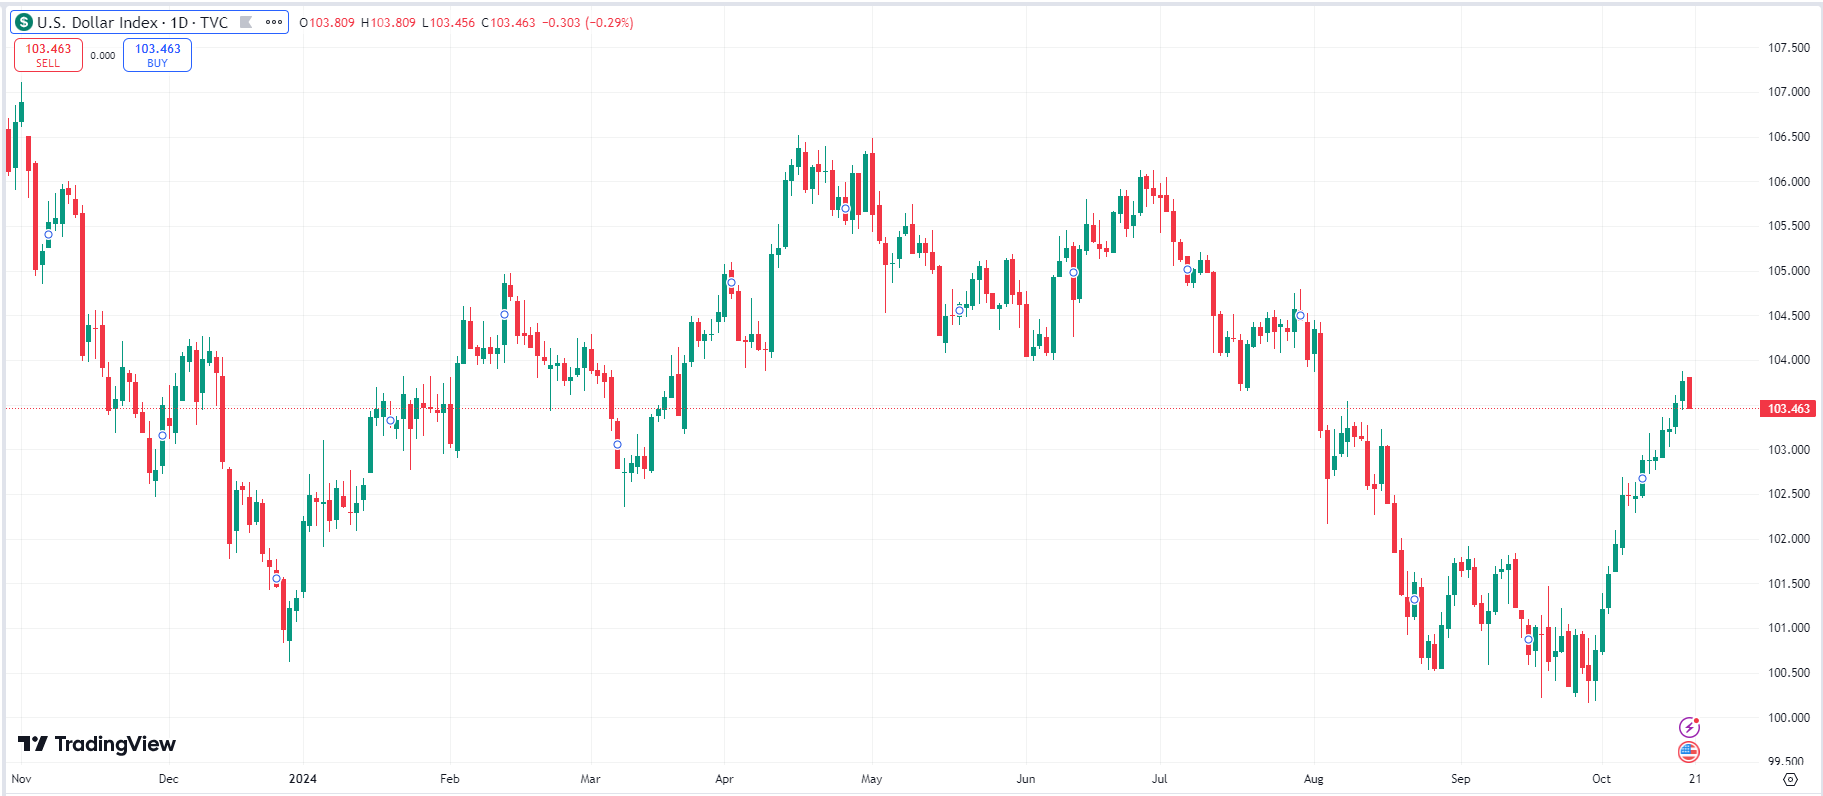
Let’s start with the USD, as that is the first part of the title of this article. Most people pay attention to or first look at the U.S. Dollar Index (DXY), which I introduced in the third article listed above. The daily chart for the past year is below:
On September 27, 2024, the DXY closed at 100.42, the lowest close for the year. Since then, it has moved higher 13 out of the past 15 trading days. Many, including me, were expecting the DXY to break below 100. Instead, it held support at the bottom end of the sideways channel it has been in since the end of 2022. Here is a weekly chart of the past five years:
This is one of the bigger three-week rallies we have seen, and time will tell if it can rival the rally from July to October of last year, revisiting the top end of the channel near 107 or even breaking out higher.
Why is this relevant and important to watch? A stronger USD generally creates financial stress globally, given the approximately $350+ trillion in global debt that needs to be serviced, and approximately 20% of which needs to be refinanced each year (see The Rising Tide of Global Liquidity Lifting All Assets - Michael Howell's Powerful Analysis and Provocative Forecast.)
III. Which foreign currencies are weakening the most against the Dollar?
In the fourth article cited in Section I, I covered six foreign currencies, including those of the largest economies next to ours (Europe, China, and Japan) and our biggest trading partners (Mexico, Canada, and India). Three of them—the Mexican peso, the Canadian dollar, and the Indian rupee—haven’t done much recently, so we won’t bother looking at them.
The other three, however, have shown some significant moves. Here is the daily one-year chart of the Chinese yuan:
CNY closed at its highest level of 0.1426 on September 27. As of Friday, it is down 1.3% since then. The low on Friday marked a 50% retracement of the rally from the end of July to the end of September. Will CNY bounce higher and continue its recent strengthening from here, which would be a weaker USD? Or will the USD continue strengthening, and the CNY revisit its July lows or even last year’s lower lows in November?
Here is the daily one-year chart of the Euro:
The Euro closed at 1.11764 on September 26, just shy of its highest close of the year on August 23, when it was at 1.1189. In the past three weeks, it has been down 2.8% and is back towards the middle of the range over the past year. Will it break out one way or another, or will it continue bouncing within the sideways channel?
The biggest mover is the Japanese yen, which closed at its highest level all year on September 16 at 0.007109. Since then, it is down 5.9%.
IV. What has been happening with U.S. bond yields and prices?
This is where things start to get interesting. Generally speaking, what drives a currency to strengthen or weaken relative to another currency? One of the primary drivers is interest rate differentials, meaning if one country’s interest rates are higher than another’s, then there is more borrowing in the currency with the lower interest rates (which creates more currency supply) to buy the currency with the higher interest rate and capture the higher yield that country’s bonds offer.
Okay, and we just reviewed that the USD has been strengthening recently… but hold on! Didn’t the Federal Reserve cut interest rates by half a percentage point on September 19?!? Yep! Remember that the Fed only controls the Federal Funds Rate, the overnight lending rates banks charge one another. This interest rate greatly influences the short end of the U.S. Government’s term structure of its debt instruments (a.k.a. yield curve), such as short-term Treasury bills with less than one-year duration. However, the influence the Fed Funds Rate has on medium-term notes (2-10 year duration) and bonds (10 years and greater duration) diminishes as the duration gets longer.
Despite the Fed’s rate cut on September 18, the 10-year Treasury yield hit its lowest level in over a year at 3.6% on September 17. It climbed on the day the Feds cut interest rates and continued climbing since, closing at 4.085% on Friday or 48 basis points higher. The 30-year bond also hit its low on September 17 at 3.899% and closed Friday 49 basis points higher at 4.39%.
And since yields and prices move inversely, longer-term bond prices have fallen. Here is a daily one-year chart of TLT, the iShares 20+ Year Treasury Bond ETF:
TLT prices are down 7.4% since its closing high on September 16. More alarming, TLT prices are down 48% since peaking in March 2020:
What happened in March 2020? COVID-19 and the explosion in Federal deficits and debt very soon after that. Given the outlook for Federal deficits and debts to continue rising, I firmly believe with very high conviction that longer-duration bond prices will continue to suffer compared to the preferred hard assets of gold, industrial commodities, energy, and their miners and producers.
V. What about U.S. bond market volatility?
Did you catch the reference to the MOVE index in the title of this article? The U.S. Bond Market Option Volatility Estimate (MOVE) Index. Please click over to read Section VI of “Everyone is Missing the Point about the Fed's Rate Cuts in 2024 - What is the point, what does it mean, and what can we expect?”
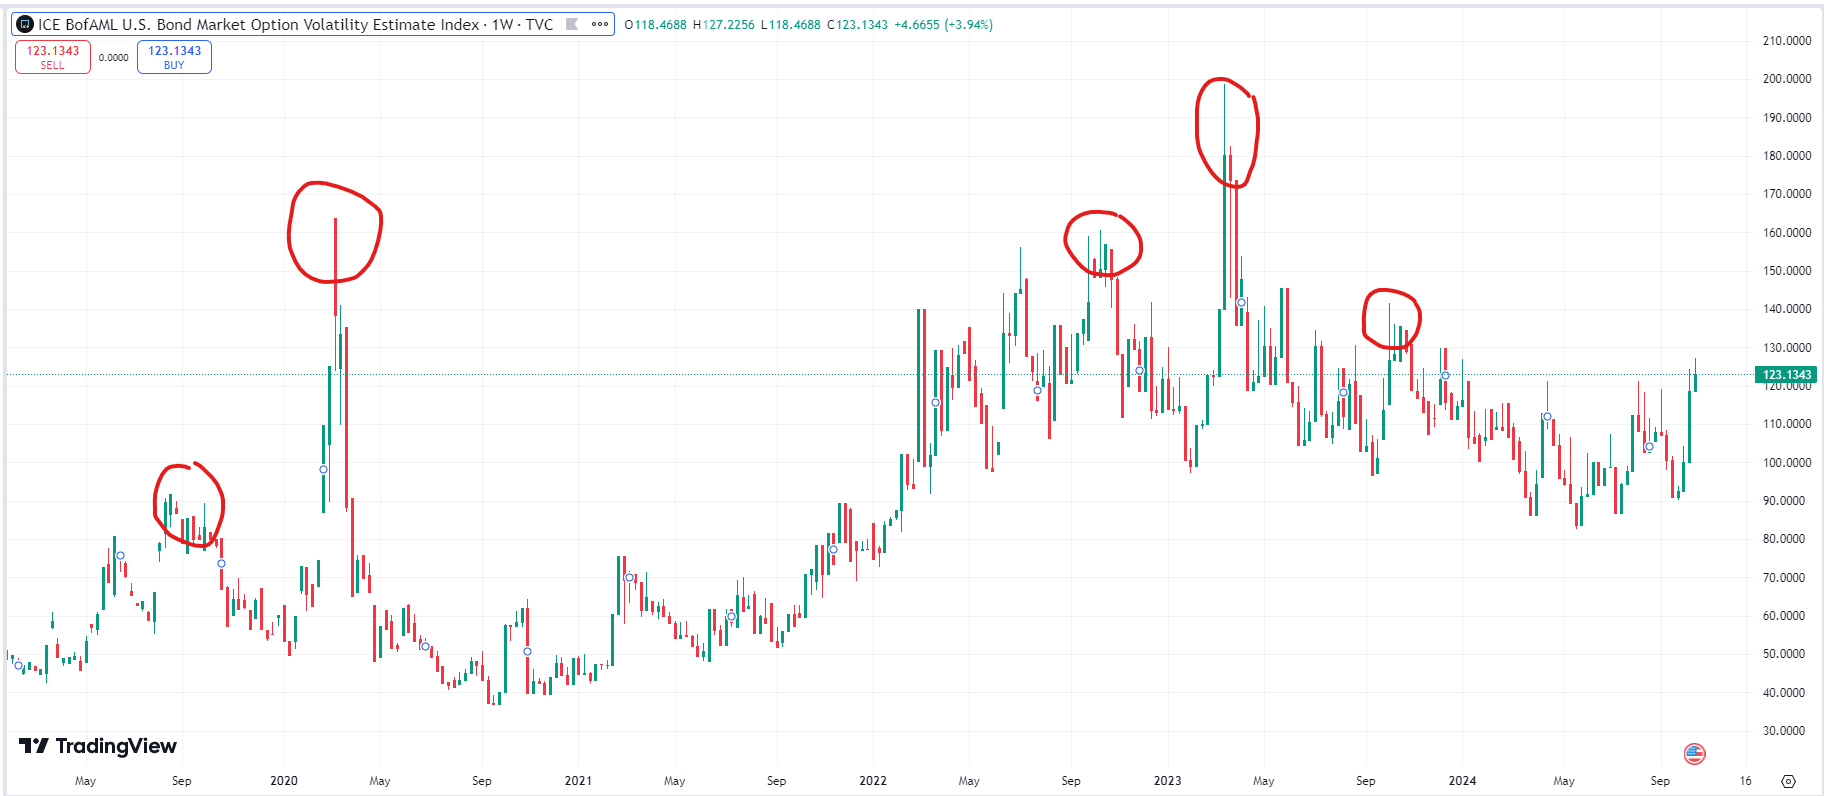
Okay, so now that you have been refreshed on the MOVE index and its meaning, you also understand its correlation with the U.S. Dollar. Here is a current chart of the MOVE index going back to 2019, with each of the prior five times that the Fed and/or U.S. Treasury injected massive amounts of U.S. Dollar liquidity into the financial system to keep the U.S. Treasury market functioning.
As you can see, we are very close to the level in October and November 2023, when the Treasury pivoted to auctioning far more short-duration Treasury bills as the market could not absorb any larger supply of longer-duration Treasury notes and bonds without yields spiking out of control.
The MOVE index indicates that the bond market has experienced its highest stress level since the end of last year. The Fed and/or Treasury may already be working on supplying more U.S. Dollar liquidity to relieve that stress. And if not, and if the U.S. Dollar continues charging higher, then it is only a matter of a short amount of time before they do.
VI. What does this all mean for equities?
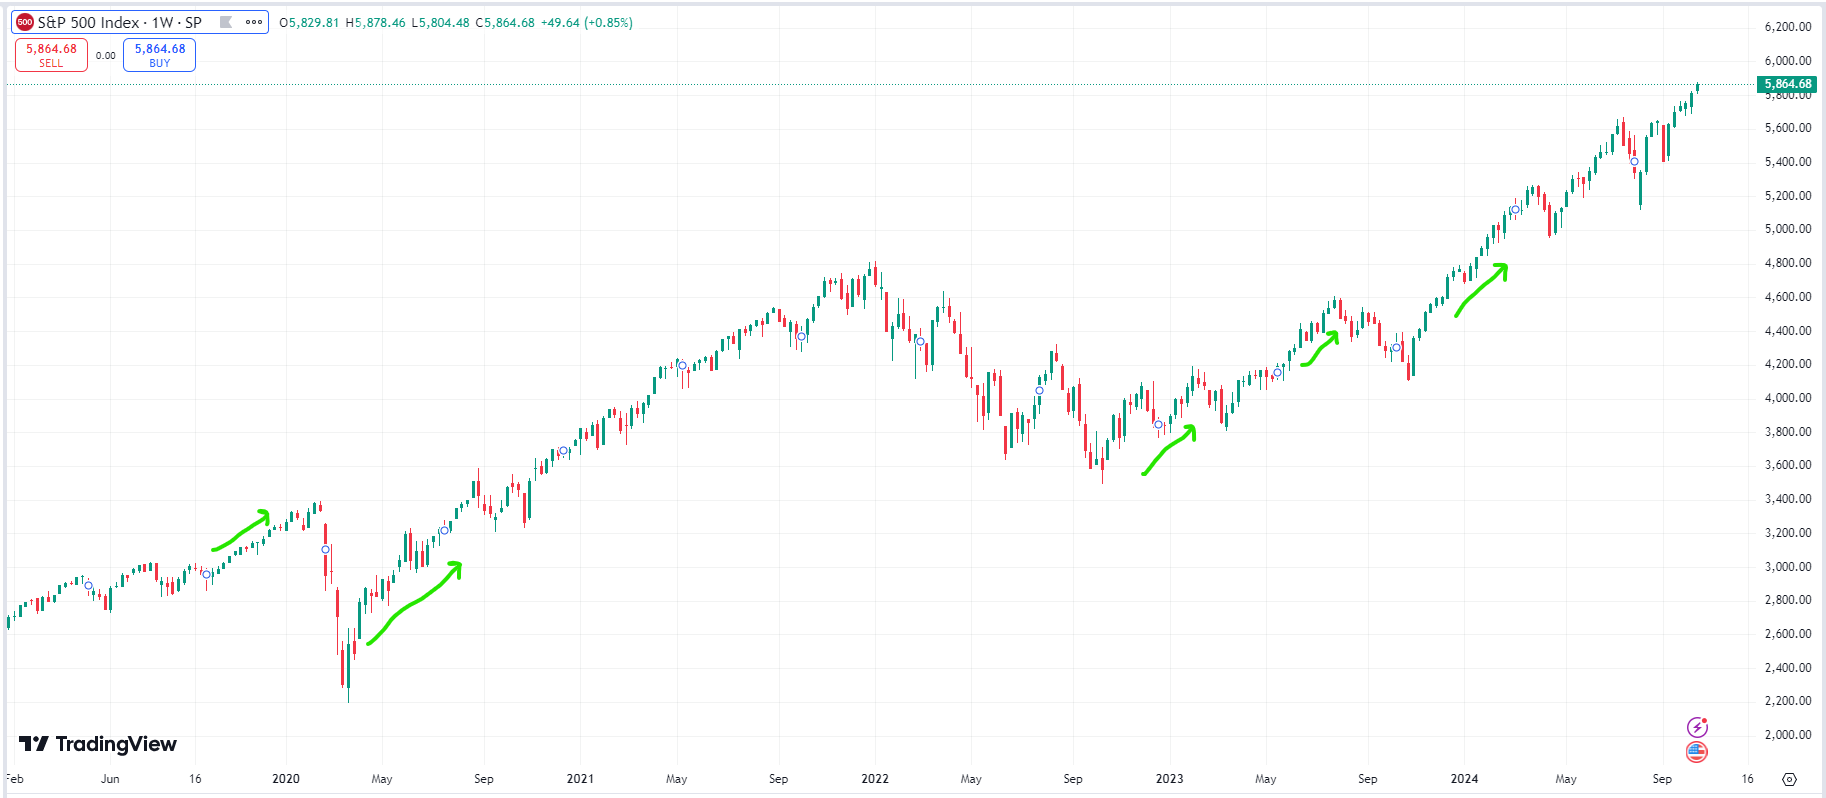
Yep - you guessed it. More Dollar liquidity finds its way into the equity markets, pushing prices to new highs - or at least new recent highs. Here is a chart of the S&P 500 with green arrows showing the market movement in the weeks following each of the five prior episodes of Dollar liquidity injection.
Now, we are already sitting at all-time highs. Perhaps, like Pavlov’s dog, the market has become conditioned to expect dollar liquidity under these circumstances, and the market has been bid up in anticipation of it.
VII. What about gold prices?
Interestingly, very few are talking about gold, yet its prices have risen 37% in the past 12 months. On Friday, gold again closed at a new all-time high of $2,721.20 per ounce.
But wait a minute… Doesn’t gold typically move opposite the Dollar?
Ahh, yes - this is where things get really, really interesting. And this is why Brent Johnson’s Dollar Milkshake Theory has been so controversial. He foresaw a world in which the U.S. Dollar, U.S. equities, and gold prices all move higher - which was deemed crazy and unheard of because, historically, that is not the way things usually worked.
In the next section, I will tell you what some people say about various correlations. Then, in Section IX, what I think, and in Section X, why should you care and, more importantly, what more can you do about it? However, I have hit a new paid subscriber threshold, so you must now be a paid subscriber to view the last three sections. The X Project’s articles always have ten sections. Soon, after a few more articles, the paywall will move up again within the article so that only paid subscribers will see the last four sections, or rather, free subscribers will only see the first six sections. I will be moving the paywall up every few weeks, so ultimately, free subscribers will only see the first four or five sections of each article. Please consider a paid subscription.
All paid subscriptions come with a free 14-day trial; you can cancel anytime. Every month, for just the cost of two cups of coffee, The X Project will deliver 6-8 articles (weekly on Sundays and every other Wednesday), helping you know in a couple of hours of your time per month what you need to know about our changing world at the interseXion of commodities, demographics, economics, energy, geopolitics, government debt & deficits, interest rates, markets, and money.
You can also earn free paid subscription months by referring your friends. If your referrals sign up for a FREE subscription, you get one month of free paid subscription for one referral, six months of free paid subscription for three referrals, and twelve months of free paid subscription for five referrals. Please refer your friends!


