Currency Crash Round-Up
What can Forex market moves tell us about what's happening? - Article #81
In this 16-minute article, The X Project will answer these questions:
I. Why this article now?
II. What has the DYX been doing lately?
III. What is the USD doing against the Euro?
IV. How about against our largest trading partners?
V. How is the USD doing against the currency of the second-largest economy?
VI. How about against the Japanese yen?
VII. Was the Indian rupee affected?
VIII. How have these fiat currencies traded against hard money?
IX. What does The X Project Guy have to say?
X. Why should you care?
Reminder for readers and listeners: nothing The X Project writes or says should be considered investment advice or recommendations to buy or sell securities or investment products. Everything written and said is for informational purposes only, and you should do your own research and due diligence. It would be best to discuss with an investment advisor before making any investments or changes to your investments based on any information provided by The X Project.
A special note. To celebrate the publication of the 80th article last week of The X Project, this article is being made available to free subscribers in its entirety. Please do me one, more, or all of the following favors:
Like this article by clicking heart icon/like button at the end of the article
Leave a comment sharing why you like it
Share this article with a friend:
Refer your friends. If your referrals sign up for a FREE subscription, you get one month of free paid subscription for one referral, six months of free paid subscription for three referrals, and twelve months of free paid subscription for five referrals.
Become a paid subscriber to support The X Project’s effort:
I. Why this article now?
Last week, I published “De-dollarization - Part 2: What's good, what's bad, for whom, and why?” In Section I, I noted:
“Gold prices (in U.S. Dollars/USD) climbed to new all-time highs, with the spot price ending the week at $2,509.60 per ounce. The U.S. Dollar Index (DXY) declined to its lowest level this year since the last week of December 2023.”
That’s a good reason to examine the broader foreign exchange (Forex) markets for currencies to see recent developments. But before we get into it all, I want to point out some other articles you should have read to provide proper context and background, and also another reason for why this article now.
Of course, “De-dollarization—Part 2” was a follow-up to “De-Dollarization—Part 1: What’s all this talk, what does it mean, and what’s really going on?” I did not get into specific currency markets in those articles. Instead, I looked at the geopolitical movement by the BRICS countries to move away from the U.S. Dollar (USD) as the primary global reserve currency (GRC) and U.S. Treasurys (UST) as a global reserve asset.
Before those articles, I wrote “Money and Currency: What are they, how are they created, and why does it matter?” This foundational article defined the concepts and mechanics of creating money and currency. In hindsight, I should have written that article before writing “What's Going on with Currencies These Days? An Introductory Primer to Foreign Exchange Markets” four months ago.
Looking back a little further, at the end of last year, I wrote, “Everyone is Missing the Point about the Fed's Rate Cuts in 2024 - What is the point, what does it mean, and what can we expect?” At the time, the markets were excited about a possible Fed pivot to easing interest rates, which has not happened yet. However, that article is still relevant, and Fed Chair Powell just told us that the first interest rate cut is coming in September.
At the end of February, I wrote “Why Rate Cuts, a lower US Dollar, and Inflation will All be Returning Soon - Revisiting Fiscal Dominance and the US Policymaker's Only Choice,” which is still very relevant today. And since I made the call a lower USD would be returning soon, this is a good time to take stock and see where things stand.
II. What has the DYX been doing lately?
First, a reminder that the DXY is a 1973-created weighted index of six currencies (Euro 57.6%, Japanese yen 13.6%, British pound 11.9%, Canadian Dollar 9.1%, Swedish Krona 4.2%, and Swiss Franc 3.6%) whose weights have no relation to anything in reality.
Notwithstanding, many market commentators and analysts focus on the DXY as a general yardstick to measure how the USD is doing. Here is the one-year chart:
As you can see, the DXY is at the bottom of its range. It made a new low last week after dropping about 5% since April.
The longer-term perspective shows that the DXY has spent more time lower vs. higher than today’s levels over the past fifty years.
III. What is the USD doing against the Euro?
The DXY gives you a strong hint, given that the Euro comprises over half the index.
As you can see, the chart of Euros priced in USDs looks like the inverse of the DXY chart, with the Euro at the high end of its one-year trading range after recently making a new yearly high and trending higher by about 4.5% since April. Remember, the Euro up means the USD down.
Here is the long-term view:
Aside from being the majority of the DXY, why do we care about the Euro? As measured by gross domestic product (GDP), the EU's economy is the third largest behind the United States and China, while the EU’s GDP per capita is the second highest globally.
IV. How about against our largest trading partners?
Remember that our two largest trading partners are Mexico and Canada.
Looking at the Mexican peso, we see a change of scenery in that the USD has been strengthening by roughly 20% against the peso over the past five months (the peso down means the USD up):
From a longer-term perspective, however, we see that the peso is at about the middle of its range over the past eight or nine years:
The Canadian Dollar is interesting because it made a new yearly low against the USD before a robust 3% rally this past month, returning to its level at the beginning of the year.
From a longer-term perspective, the Canadian Dollar has been 15% lower but over 35% higher.
V. How is the USD doing against the currency of the second-largest economy?
Since the beginning of the year, the Chinese yuan has drifted lower (USD drifting higher). But then, in late July through August, the yuan rallied (USD fell) by nearly 3% to the high end of its 1-year range.
Zooming out, we can see that the yuan was almost 18% stronger (USD weaker) at the end of 2013 and early 2014.
VI. How about against the Japanese yen?
This is the one that has received all of the news and commentary of late. And it wasn’t just about the yen, but the “carry trade” unwind and its impact on broader markets. Let’s start by looking at its charts.
As you can see, the yen was at its weakest level in a year in mid-July, when it rallied over 12% to its highest level in 2024. Looking further out, July’s low was lower than in 1998 and the lowest since 1990.
What happened? The Bank of Japan (BoJ) raised interest rates from 0% to 0.25% on July 31 after ending its negative interest rate policy in March, when it raised rates from -0.1% to 0%.
Why is that a big deal? The March rate hike was the first in 17 years. Since interest rates were slightly negative, many financial institutions, hedge funds, and traders borrowed yen to convert to other currencies (mostly USD) to invest in other assets. As long as the yen was falling or at least not rising too quickly, it was a “no-brainer” of a “carry trade.”
There was a short-covering rally when interest rates were raised to positive at the end of July. Some of the carry trade was unwound as traders sold assets and scrambled for yen to pay off yen-denominated debt, and this was some of the blame for the sharp three-day sell-off in stock markets the first three days of August.
VII. Was the Indian rupee affected?
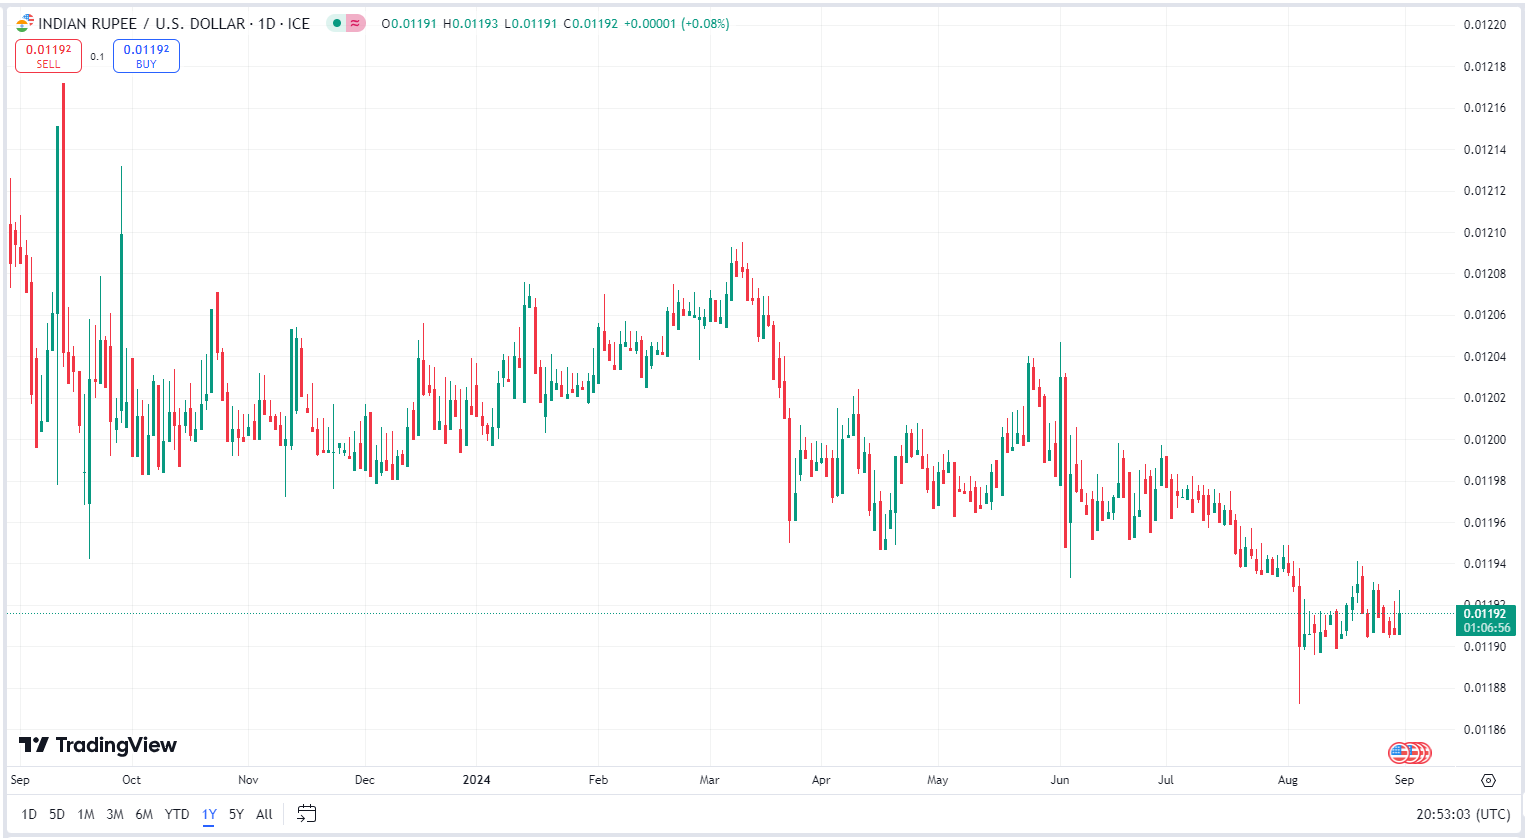
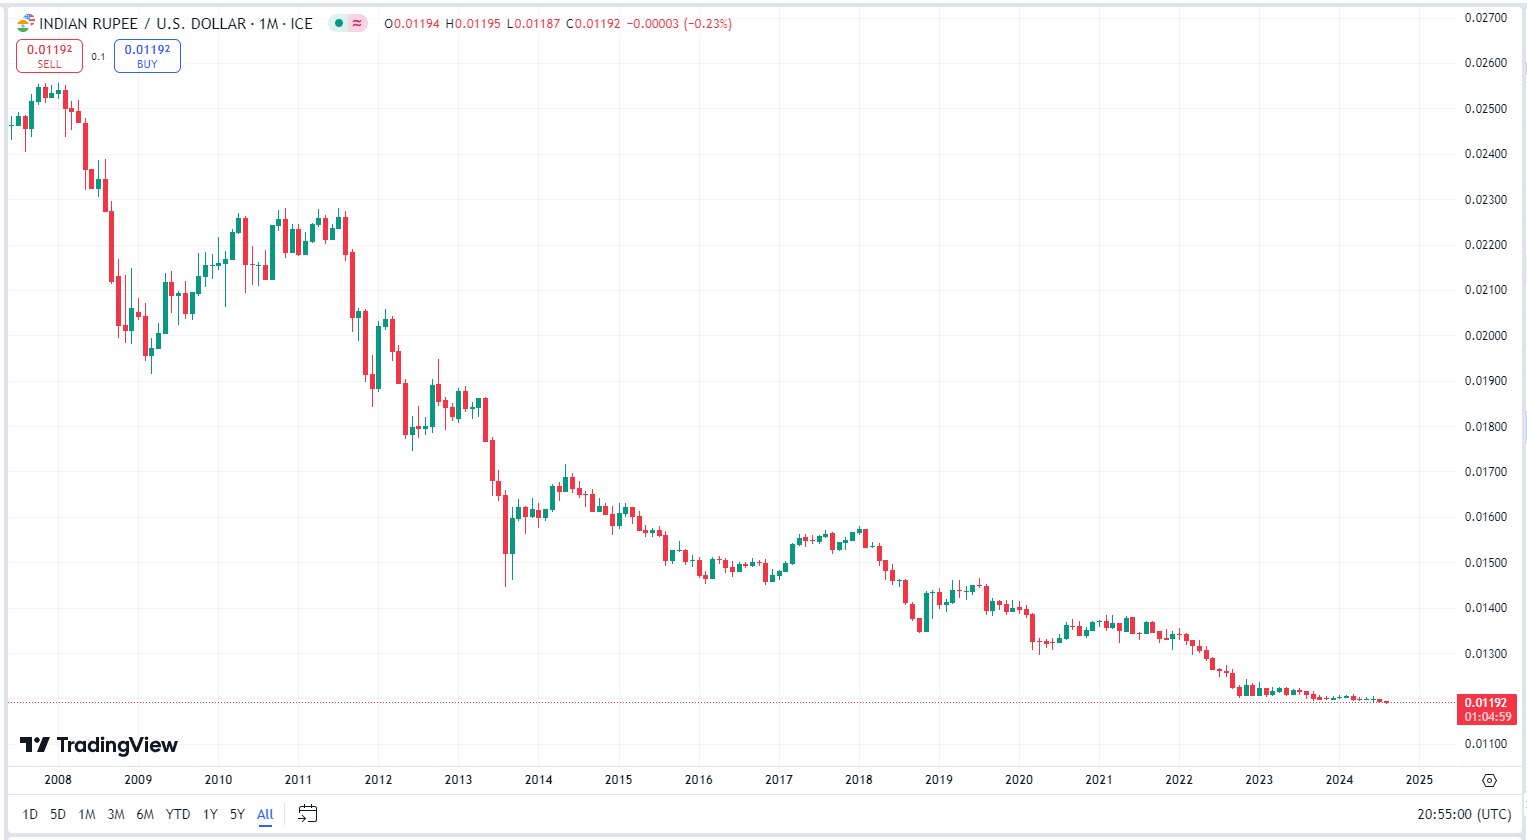
The rupee made a new low on August 5 and has since traded sideways.
And the new low in August continued the weakening trend against the dollar.
VIII. How have these fiat currencies traded against hard money?
In all of the charts above, a paper fiat currency is being compared against another paper fiat currency. How do these currencies look compared against gold? Let’s take a look, starting with the USD:
It is shocking to realize that the USD has lost over 90% of its value since 2001.
And maybe even more shocking that it lost approximately 50% of its value over the last five years. Is this reality just a problem with the USD? Here is a chart showing the USD along with the Canadian Dollar, Euro, and Swiss franc:
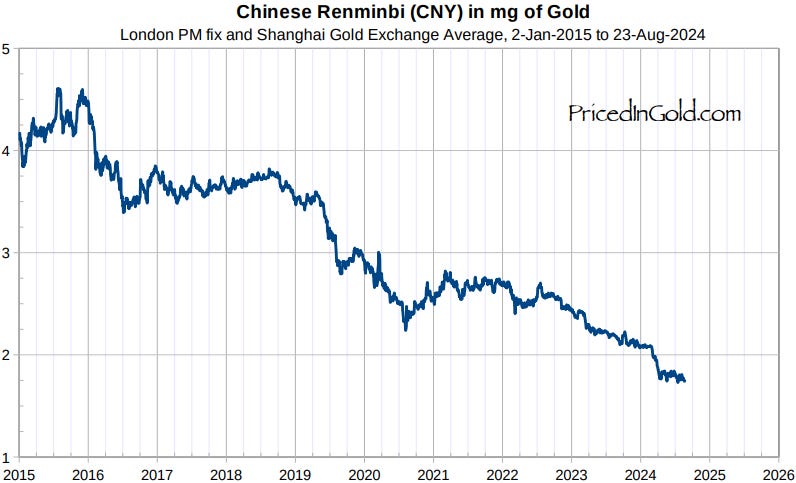
And here is the chart of CNY (Chinese renminbi/yuan) priced in gold:
What about the Japanese yen?
As you can see, all fiat currencies all falling in value relative to gold, which I’ve pointed out many times before is expected as that is what has happened to all fiat currencies throughout history. So when we compare a fiat currency to a fiat currency, we are comparing the two things that are both falling in value. Hence the title to this article.
But, this gives a warped sense of what is really going on…
IX. What does The X Project Guy have to say?
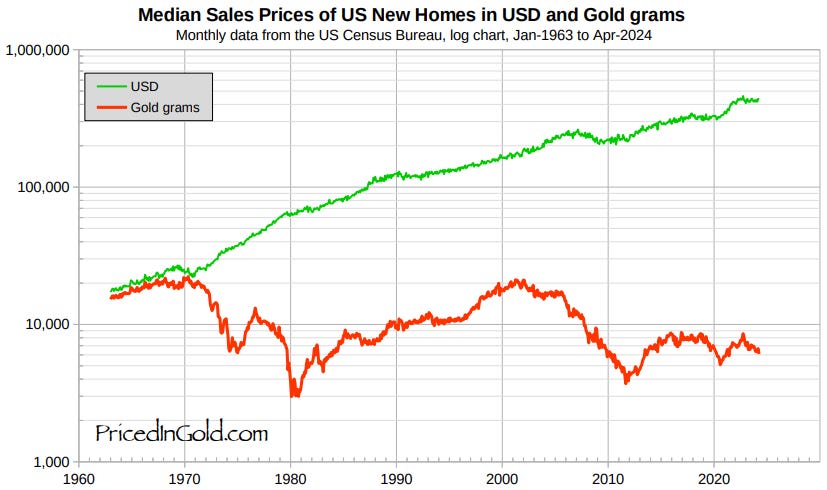
The best example of how warped are perceptions have become is U.S. housing prices. There is a lot of talk about the housing affordability crisis, and how expensive houses have become. I think most people agree.
However, this is not an issue with housing prices, but an issue with the denominator used to the price houses. Housing prices in gold are well within their historical range of prices in gold terms and cheaper than they were in the 1960s…
…and as cheap as house prices were in the 1930s.
Why would you want to save in dollars and invest in dollar denominated assets once you realize this? Let me share two more charts. Do you think the S&P 500 is just off of its all-time highs?
Nope - not priced in gold, and not even close. The S&P is where it was 18 years ago. More shockingly, it is also at the same price as it was in the 1960s, below the prices of the 1970s, and ~60% less than its all-time highs priced in gold.
In fact, looking at S&P prices in gold terms through a long historical lens, we see that the stock market is still relatively expensive. How much so? It could fall over 90% in gold terms to revisit the 1980 low prices.
Ok, so you might think I turned the tables on you by saying this article was about currencies and ending up by talking about gold. But I didn’t. Gold is money, and its role as a currency is returning to our modern global economy as I explained in last week’s article, “De-dollarization - Part 2: What's good, what's bad, for whom, and why?”
X. Why should you care?
Most people are the proverbial frogs cluelessly sitting in a pot of water that has been heating up their whole lives and will soon boil them to death. Subscribers to The X Project have heard this message over the past 80 articles I’ve written where I’ve warned about the continuing and potentially accelerating rate of currency debasement. Hopefully, you’ve already started accumulating gold.
If you haven’t or feel like you need more gold, should you liquidate a bunch of other assets next week and buy a lot of gold? Not necessarily. I am not providing investment advice and just providing information for you to consider. Personally, I would suggest starting with some sort of dollar-cost averaging strategy where you buy a regular amount of gold bullion at regular intervals. Furthermore, as I shared with paid subscribers last week, gold prices in USDs may be due for significant 20-25% pullback soon:
I subscribe to northstarbadcharts.com, which provides free technical information on X @NorthstarCharts and @badcharts1.
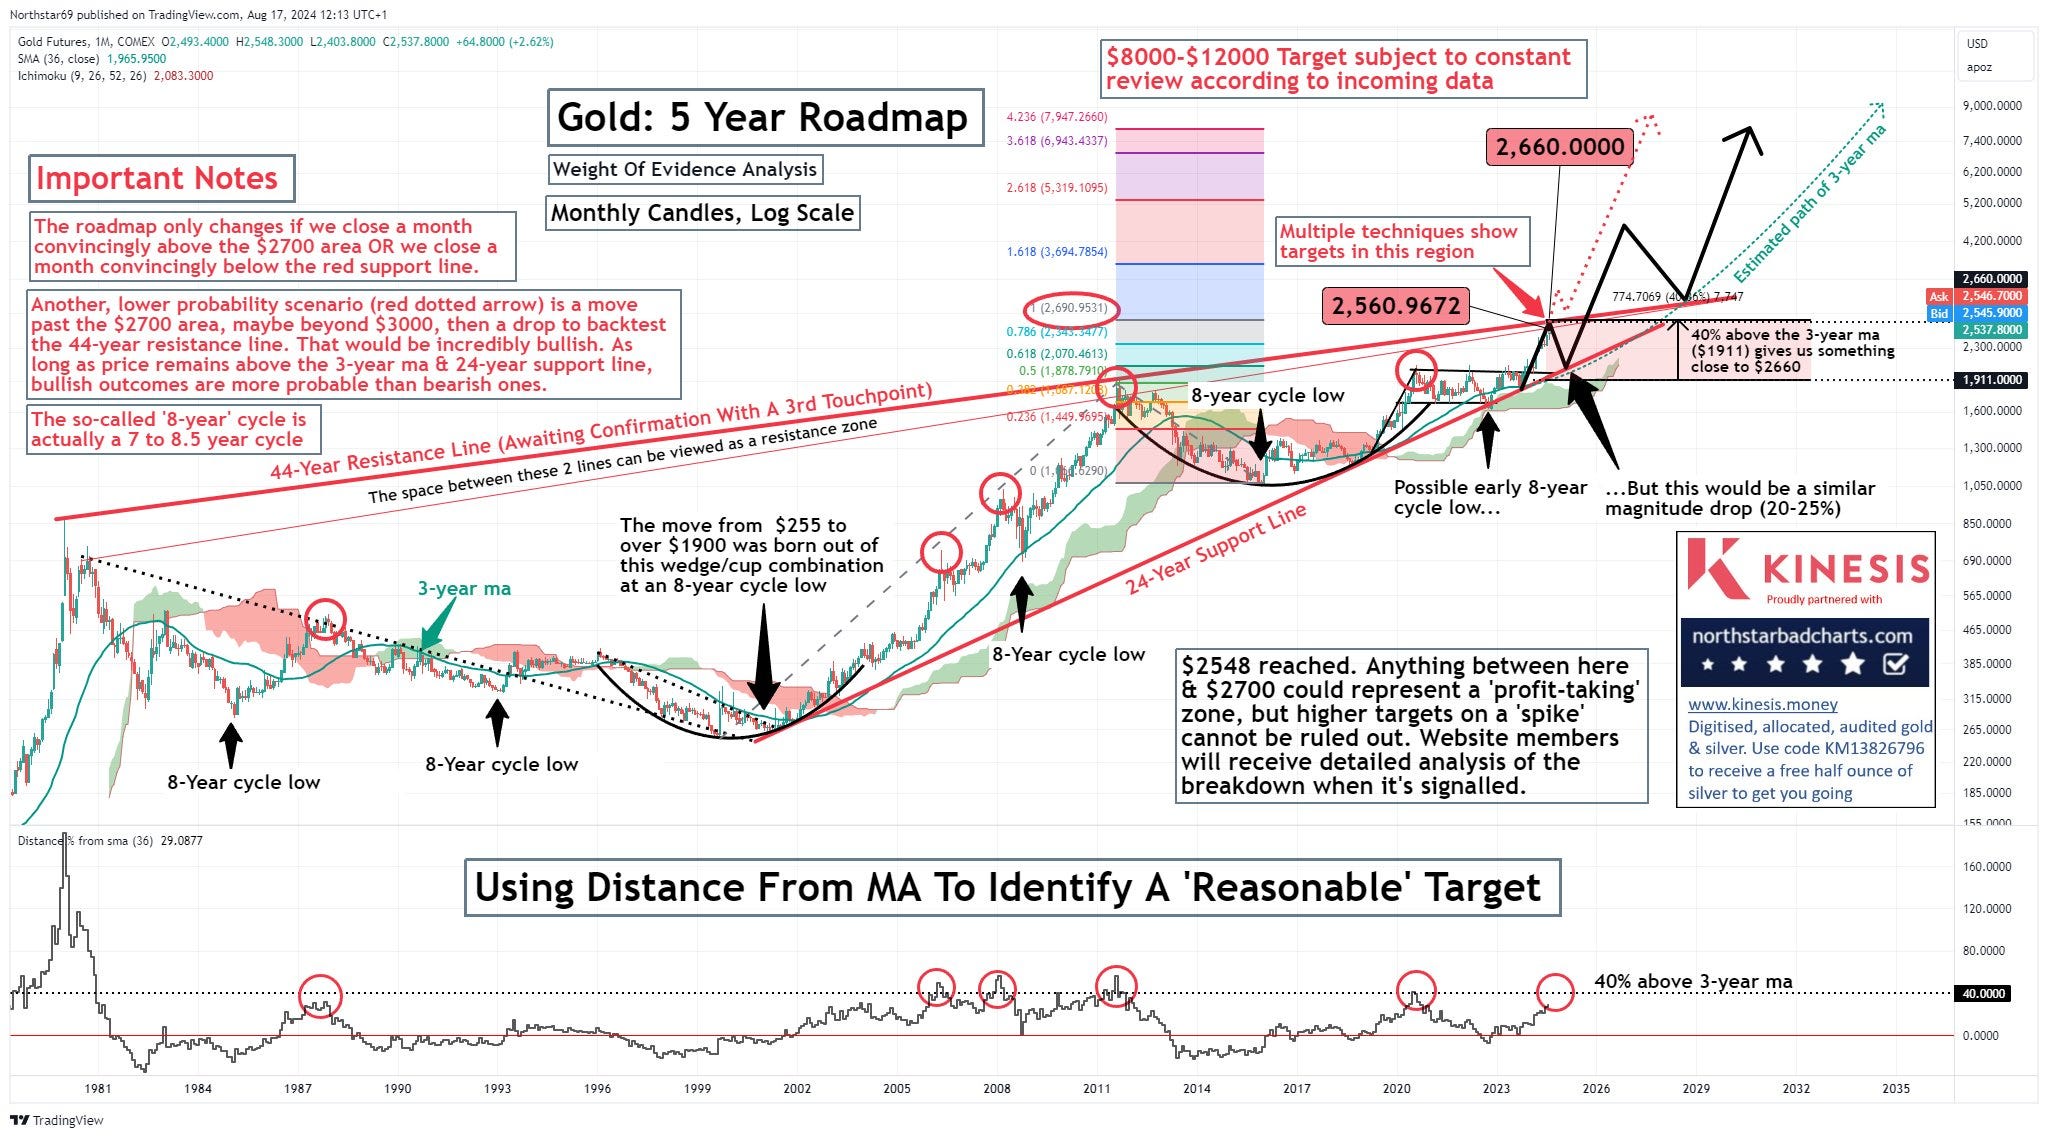
Below is the publicly available Gold: 5 Year Roadmap that was published on X on August 17 with the following note: “$2,548 reached. Anything between here and $2,700 could represent a ‘proft-taking’ zone, but higher targets on a ‘spike’ cannot be ruled out.”
If you follow the solid black line, which is a projection of possible future prices, the note with a big solid red arrow points to a short-term peak in prices between $2,560.9672 and $2,660.0000, stating, “Multiple techniques show targets in this region.” Then, the solid black line moves lower, with a big solid black arrow pointing to a back-test of the 24-year support line, with a note stating, “…But this would be a similar magnitude drop (20-25%).”
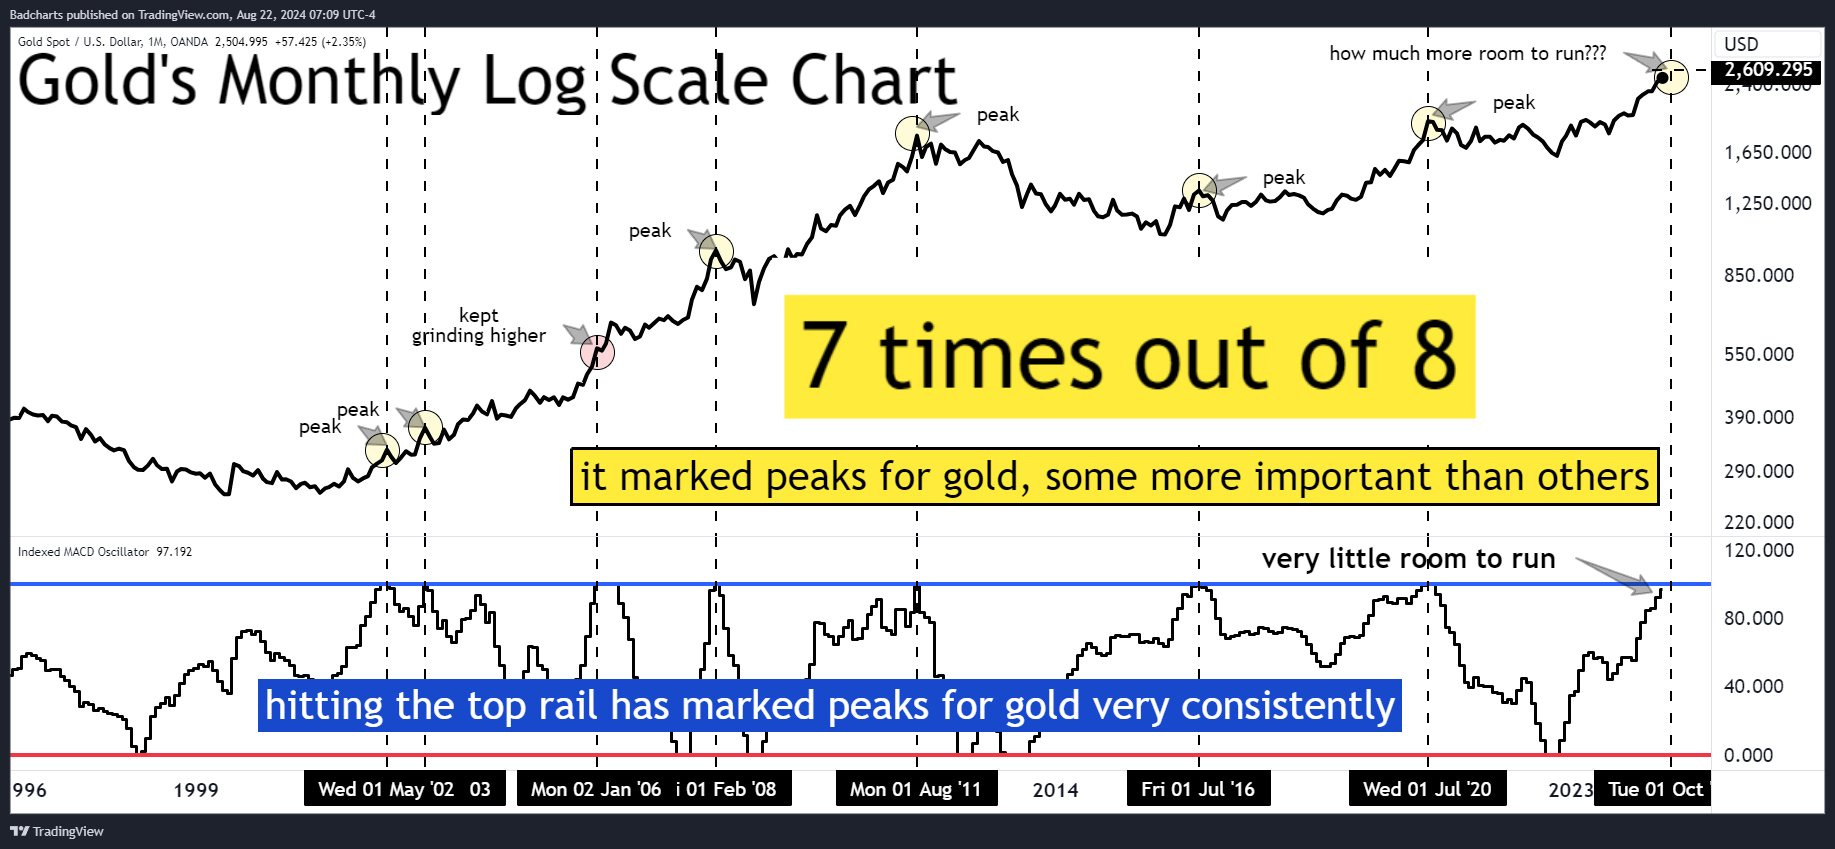
A couple of days later, this chart was posted:
Since founding The X Project - and for several years before- I have been a strong advocate of accumulating gold and bullish on gold prices. However, prices do not move in straight lines over time, and there are retracements, pull-backs, and reversions in price within broader long-term trends. Identifying them in advance and trading them successfully is not easy. And even professionals who trade using technical analysis for a living are not always right. Will the technical analysis in Section VIII above prove correct? I have no idea.
However, because it might be, and I agree that gold is due for a significant pullback given its recent run this year since breaking out above $2,000 per ounce, I bought some insurance this week by buying December GLD puts. If there is a 20-25% pullback, those GLD puts should at least cover the decline in value (if not a good amount more) of the shares in OUNZ that I own. And then, if and when I sell those puts at a nice profit, I will use that cash to buy more OUNZ.
For those who are unfamiliar, let me close with the ten investment themes to which I subscribe and follow with my own portfolio, and let me provide some more detail than I have in the past:
Overweight cash and short-term U.S. T-bills for optionality, given expected volatility related to the remaining list below.
I maintain a balance in all maturites of less than 1-year in U.S. T-bills that I buy using a TreasuryDirect account.
Bullish gold and gold miner equities
Half of my gold position is in gold coins that I keep in my own safe that I buy from my local coin shop using cash or buy online from nationwidecoins.com or goldsilver.com
Half of my gold position is in the VanEck Merk Gold ETF OUNZ which can be exchanged for physical bullion (avoids capital gains taxes) which I have not done but intend to do at some point.
I own both major and junior miners through GDX and GDXJ and many of the individual listings within those ETFs.
Bullish Bitcoin
I have a minimal Bitcoin position in Coinbase after taking profits earlier this summer based on this: https://x.com/NorthstarCharts/status/1828561939024294310
I intend to buy a lot more Bitcoin at (hopefully) lower prices using dollar cost averaging, and I will move my Bitcoin from Coinbase to a self-custodied hard wallet soon after accumulating a significant stake
Bullish oil and oil-related equities
I own major oil producers (XOM, CVX, MRO, OXY, BP, SHEL, etc.)
I own oil servicers (HAL, SLB) and drillers (BORR, RIG, TDW, VAL),
Bullish natural gas and related equitie
I own producers (AR, RRC, VNOM)
I own pipelines (ENB, MPLX, SUN)
Bullish uranium and related equities
I own ETFs URA and URNM
I also own several smaller and more speculative junion uranium mining stocks
Bullish industrial-associated commodities and equities
I own aluminum producer (AA), copper producers (FCX, RIO, SCCO) and other industrial metal producers (BHP, GLCNF, GLNCY)
I own silver bullion, SIL, and several speculative positions in junior silver miners
Bullish agricultural-associated commodities and equities
I have small positions in ADM and BG
I own minimum positions 10+ farms through Farm Together, Farm Fundr, and AcreTrader.
Bullish industrial and primarily electrical infrastructure equities
I own EMR, GNRC, HMDPF, POWL
Bearish long-dated U.S. and other Western sovereign bonds
I own December 2024 puts on TLT
Thank you for your subscription. Your support is everything to The X Project and is greatly appreciated. Please do me one, more, or all of the following favors:
Like this article by clicking heart icon/like button at the end of the article
Leave a comment sharing why you like it
Share this article with a friend:
Refer your friends. If your referrals sign up for a FREE subscription, you get one month of free paid subscription for one referral, six months of free paid subscription for three referrals, and twelve months of free paid subscription for five referrals.
Become a paid subscriber to support The X Project’s effort:







Learn a lot. But very complicated due to political, geopolitical, and central bank meddling. Unless you get insider knowledge like the big banks and boutiques get it's very, very hard to trade and profit.
But does reflect a lot of what's going on in the economy. Interest rates effect it considerably, almost exclusively. Know interest rates know the economy and DXY.
However, can get jacked really easy. Like the early 2000's when Greenspan was aggressively raising interest rates to slow things down. He lost control of rates all together. It was a conundrum he said in his to congress spanspeak. Says he thought reflecting years later it was eastern Europe opening up (cheap labor) but that was 10 years before? The bankers said they couldn't figure out why raising rates would still get a juicing economy, and weak dollar?
It was the Chinese buying so many of our bonds to keep their currency low and to put all those dollars some place. Joining the WTO and getting more special favored status for the big boys to invest in and make more easy money the bond market quit functioning like it had and hasn't been the same since that and all the juicing. So here, if you were betting stronger dollar because of rising rates you would have got jacked. SUPPOSEDLY everyone was clueless? Oh well.
I like that in some posts you keep giving more details about your strategy. Thank you.