

Navigating Uncharted Territory
Gold's Historical Rise and How Long It Can Continue - Article #128

In this 12-minute article, The X Project will answer these questions:
I. Why this article now?
II. Why is gold rallying so strongly now, and why is this move being compared to 1979?
III. How is U.S. fiscal stress driving gold’s appeal?
IV. What role is wealth inequality and social stress playing in gold’s rise?
V. How is China reshaping the gold market and global monetary system?
VI. How are U.S. policymakers and markets misreading the gold signal?
VII. How high can gold prices go and why?
VIII. What does technical analysis suggest?
IX. What does The X Project Guy have to say?
X. Why should you care?
Reminder for readers and listeners: nothing The X Project writes or says should be considered investment advice or recommendations to buy or sell securities or investment products. Everything written and said is for informational purposes only, and you should do your own research and due diligence. It is recommended to consult with an investment advisor before making any investments or changes to your investments based on information provided by The X Project.
I. Why this article now?
This was a BIG week! Why do I say that?
Well, for most people, it was a big week because of the Fed. Yes, there was a lot of talk about the political drama surrounding the Fed’s membership, but I really don’t care too much about that. And yes, the Fed cut the Federal Funds rate by 25 basis points, but that was widely expected. It was also widely expected that the Fed's cutting of interest rates would lower yields across the curve. Did it?
Nope! Here is a summary of the changes for the week:
2-Year Treasury Yield: Rose by 0.001 percentage points to 3.58%.
10-Year Treasury Yield: Rose by 0.080 percentage points to 4.138%.
30-Year Treasury Yield: Rose by 0.03 percentage points to 4.75%.
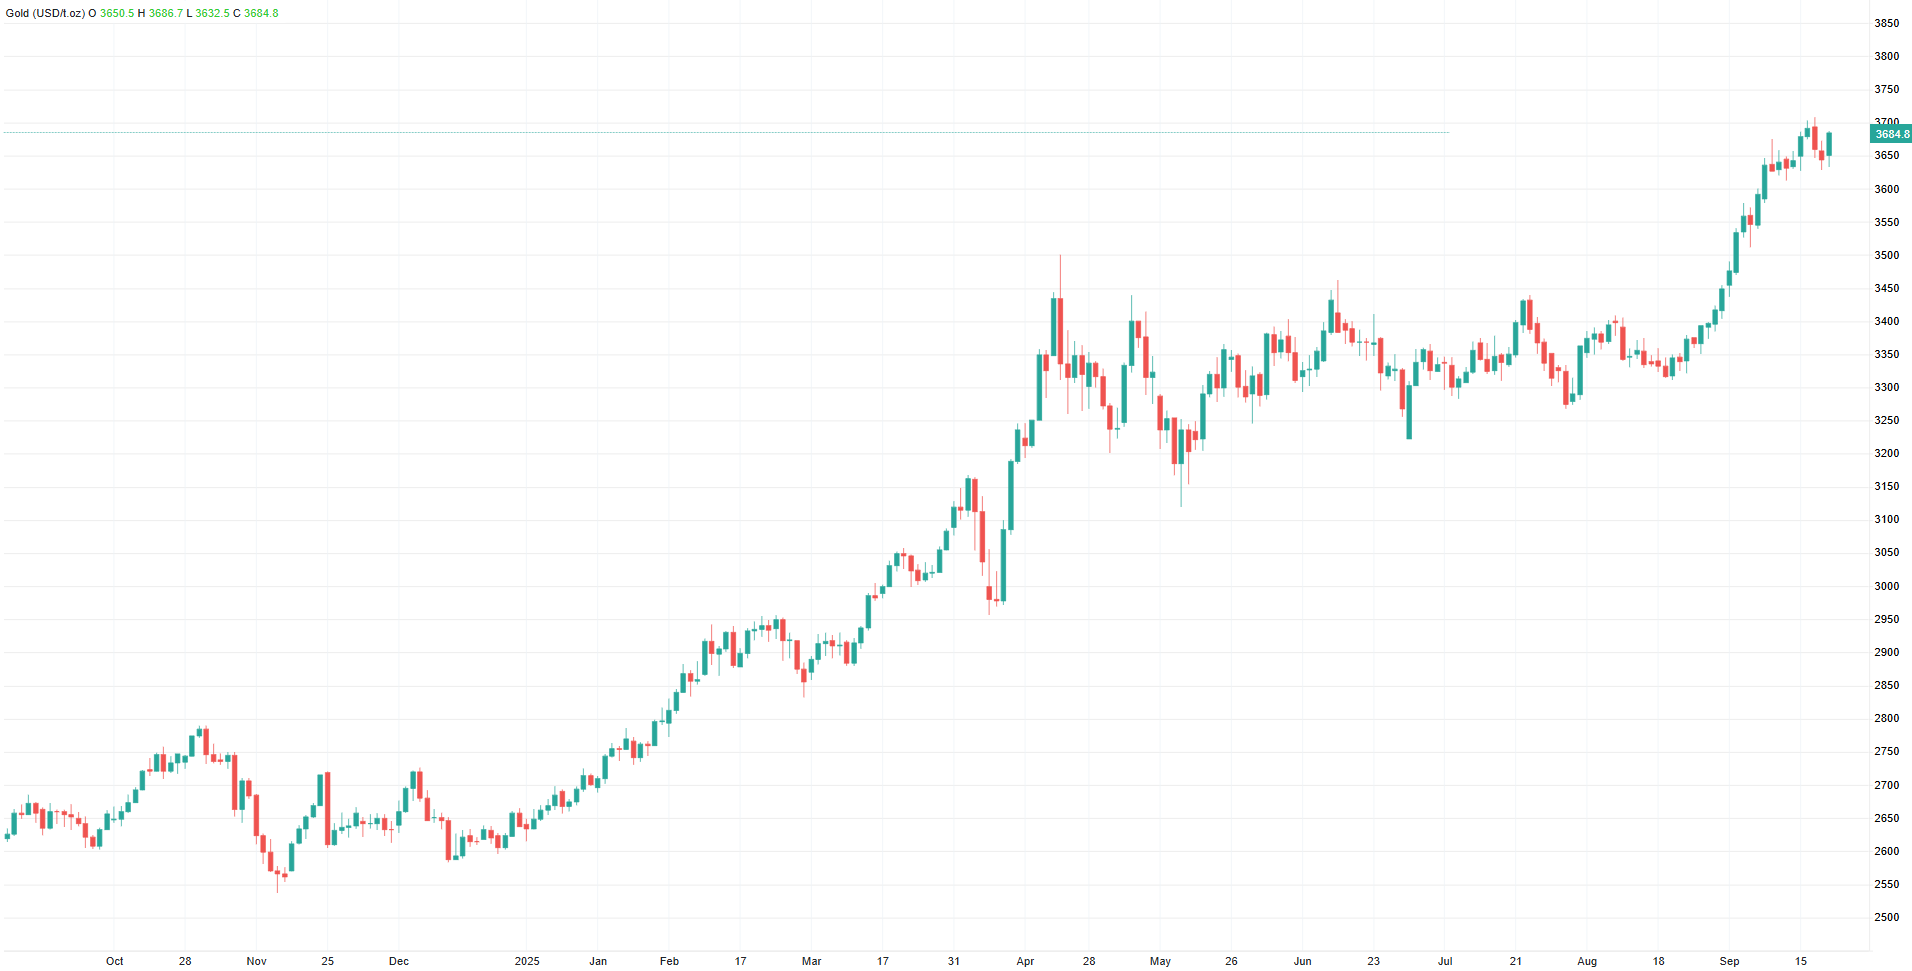
Ok, but that is not the reason for this article now. You already know this article is about gold. This week, the price of gold (in dollars, always remember the “Dollar Illusion”) closed at $3,685.80 per ounce, up another 1.1% for the week and up 7.3% from three weeks ago, when the price broke above the prior daily closing price high on April 21. But that is only indirectly the reason for this article now.
I will get to the real reason for why this article now in Section IX below. Meanwhile, here are the three most recent, previous articles I’ve written about gold for a refresher or to catch up if you missed them before, and they are all still worth reading within the context of today’s gold price and this week’s article:
And once again, I have to offer a hat tip to
at FFTT as many of the views below originated with his weekly Tree Rings reports.II. Why is gold rallying so strongly now, and why is this move being compared to 1979?
Gold has surged in 2025 at a pace not seen since 1979, prompting comparisons with the inflationary period following the U.S. break from the gold standard. The Wall Street Journal noted it is the strongest annual move in 46 years, yet today’s environment is different: instead of raising rates like in 1979, the Federal Reserve is cutting them to manage U.S. fiscal stress. This divergence is key—whereas Volcker’s Fed fought inflation with aggressive tightening, today’s policymakers are easing conditions because the debt burden prevents them from hiking without risking a fiscal spiral.
Debt dynamics are critical to this comparison. In 1979, the U.S. debt-to-GDP ratio was about 30% with a deficit of 2.5%. Today, debt exceeds 120% of GDP and deficits run at 6–7%. With interest costs already consuming over 20% of federal receipts—the highest since 1985—the Fed cannot repeat the 1970s playbook. Any aggressive tightening would accelerate a debt crisis and force some form of yield curve control. This difference makes the current rally structurally stronger than the late 1970s move.
Geopolitics adds another layer. In 1979, the Soviet Union’s invasion of Afghanistan marked a proxy war with NATO. Today, the U.S. and NATO face mounting difficulties in Ukraine, where outcomes are increasingly unfavorable for the West. Such parallels underline why both monetary and geopolitical conditions are supportive of gold, even more so than in the late 1970s.
III. How is U.S. fiscal stress driving gold’s appeal?
The core of the gold rally lies in the unsustainable trajectory of U.S. fiscal policy. Despite tariff-driven receipts and higher income tax collections, deficits remain large and persistent. Interest payments and entitlement spending now dominate the budget, creating a dynamic where the only politically feasible “cut” is interest rates. This is what Stephen Miran, the Fed Board of Governors’ newest member and President Trump’s Chairman of the Council of Economic Advisers, calls the Fed’s “third mandate”: maintaining “moderate long-term rates” to keep the debt from spiraling.
This fiscal reality forces monetary policy into financial repression. Instead of raising rates to curb inflation, the Fed must ensure that nominal growth exceeds interest costs, effectively inflating away debt. That leaves bondholders bearing losses in real terms while savers and wage earners confront rising inflation. Gold, being no one’s liability, thrives in such an environment because it preserves value outside the fiat system.
The symbolism of the Fed cutting rates despite clear signs of future inflation underscores the structural break from past cycles. Investors are slowly realizing that the fiscal position, not the business cycle, dictates monetary policy. That realization, combined with deteriorating U.S. social cohesion and political polarization, provides a strong fundamental case for continued gold accumulation.
IV. What role is wealth inequality and social stress playing in gold’s rise?
Rising wealth inequality and political violence are not abstract factors; they directly affect fiscal sustainability and investor psychology. There is a stark divide between the top 10% of earners—who now account for nearly half of U.S. consumer spending—and the bottom 90%, who increasingly struggle with mortgages and stagnant wages. This bifurcation undermines broad-based consumption growth and amplifies political instability.
At the same time, incidents of political violence, including assassinations, are at levels not seen since the 1960s. Combined with the burden of entitlements skewed heavily toward older generations, younger Americans face both economic exclusion and diminished opportunity. Such conditions echo Peter Turchin’s warnings about “elite overproduction” and social unrest, historically precursors to upheaval. (See “End Times: Elites, Counter-Elites, and the Path of Political Disintegration - A summary of the book by Peter Turchin (2023))
For investors, this environment reduces trust in fiat assets tied to the political system. If fiscal and political conditions deteriorate further, capital could flee U.S. real estate and equities, accelerating a rotation into tangible assets like gold and Bitcoin. Thus, inequality and instability serve as reinforcing drivers of gold demand.
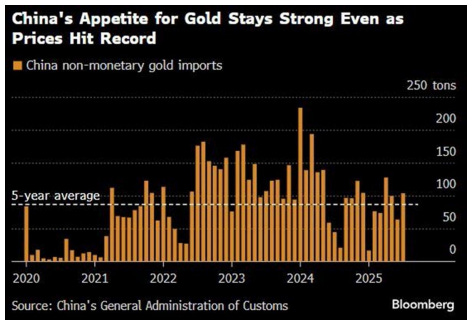
V. How is China reshaping the gold market and global monetary system?
China’s actions are a decisive force behind gold’s rally. Beijing has moved to loosen gold imports and exports while using Hong Kong as a conduit for large-scale two-way flows. This innovation allows China to maintain domestic capital controls while enabling gold settlement in yuan-based trade. Effectively, China is creating a situation where gold both anchors cross-border imbalances and strengthens the yuan’s credibility without fully liberalizing its capital account.
Domestically, Chinese households and banks already hold massive gold reserves. Since 2008, over 27,000 tonnes have been withdrawn from the Shanghai Gold Exchange, more than three times U.S. official holdings. With gold at $3,700, this translates into trillions of dollars in household wealth, providing both consumer stimulus and balance sheet reinforcement. Rising gold prices thus directly recapitalize China’s financial system while de-dollarizing reserves.
These moves represent a strategic pivot away from dollar reserves toward a commodity-backed settlement system. For the first time in modern history, the architecture of global trade is tilting toward multi-currency settlement with gold as the neutral anchor. This dynamic further undermines the dollar’s role as the world’s base layer of money, reinforcing gold’s strategic importance.
VI. How are U.S. policymakers and markets misreading the gold signal?
Mainstream U.S. financial commentary continues to underestimate gold’s significance. As the Financial Times conceded, many analysts still dismiss it as an “inert” asset, despite its breakout above $3,500. This reflects a developed-market bias: investors accustomed to stability fail to recognize that the U.S. itself is entering an emerging-market-style debt crisis.
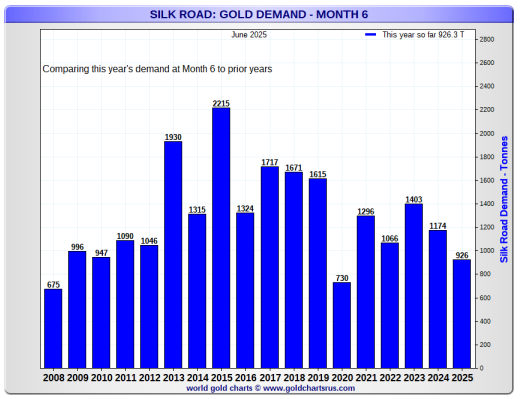
Western investors also misunderstand demand dynamics. Contrary to expectations that high prices would dampen Asian demand, gold behaves as a “Veblen good,” where rising prices stimulate, not suppress, demand. Data show 2025 Silk Road demand nearly matching 2013 levels, despite prices being three times higher. Meanwhile, global actors like Tether are investing in gold miners and bullion to diversify reserves and hedge systemic risks.
The deeper misinterpretation is treating fiat currency and Treasuries as the “base layer” of money. As Luke Gromen at FFTT emphasizes, the true base layer is energy, with gold and Bitcoin representing stored energy or stored base money. By clinging to outdated assumptions, U.S. elites remain behind the curve, ignoring the signal that gold is sending about fiscal dominance and debt monetization.
VII. How high can gold prices go and why?
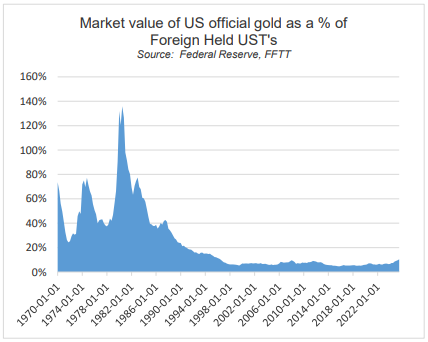
Historical ratios point to much further upside. Gold would need to double (~$7,400/oz.) merely to return to its 1989 level relative to foreign-held U.S. Treasuries, quadruple (~$14,800/oz.) to reach its long-term average, and rise thirteenfold (~$48,000/oz.) to match its 1980 peak. These comparisons illustrate how far gold remains from prior benchmarks of systemic stress.
The potential upside for gold is extraordinary when framed against fiscal and geopolitical realities. Luke Gromen of FFTT notes that if China’s 2024 trade surplus of $990 billion were settled entirely in gold, the implied clearing price would be $22,000 per ounce.
Looking at it from another perspective, Gromen pointed out that the last nuclear power plant the U.S. built in Georgia, which was recently completed, cost ~$12 billion per gigawatt. China, on the other hand, is building nuclear power plants for approximately $2 billion per gigawatt, suggesting the U.S. Dollar is massively overvalued versus the Chinese yuan. How much? Getting the price of nuclear power in line would require an 83% devaluation against the yuan, and a similar devaluation against gold also suggests approximately $22,000 per ounce.
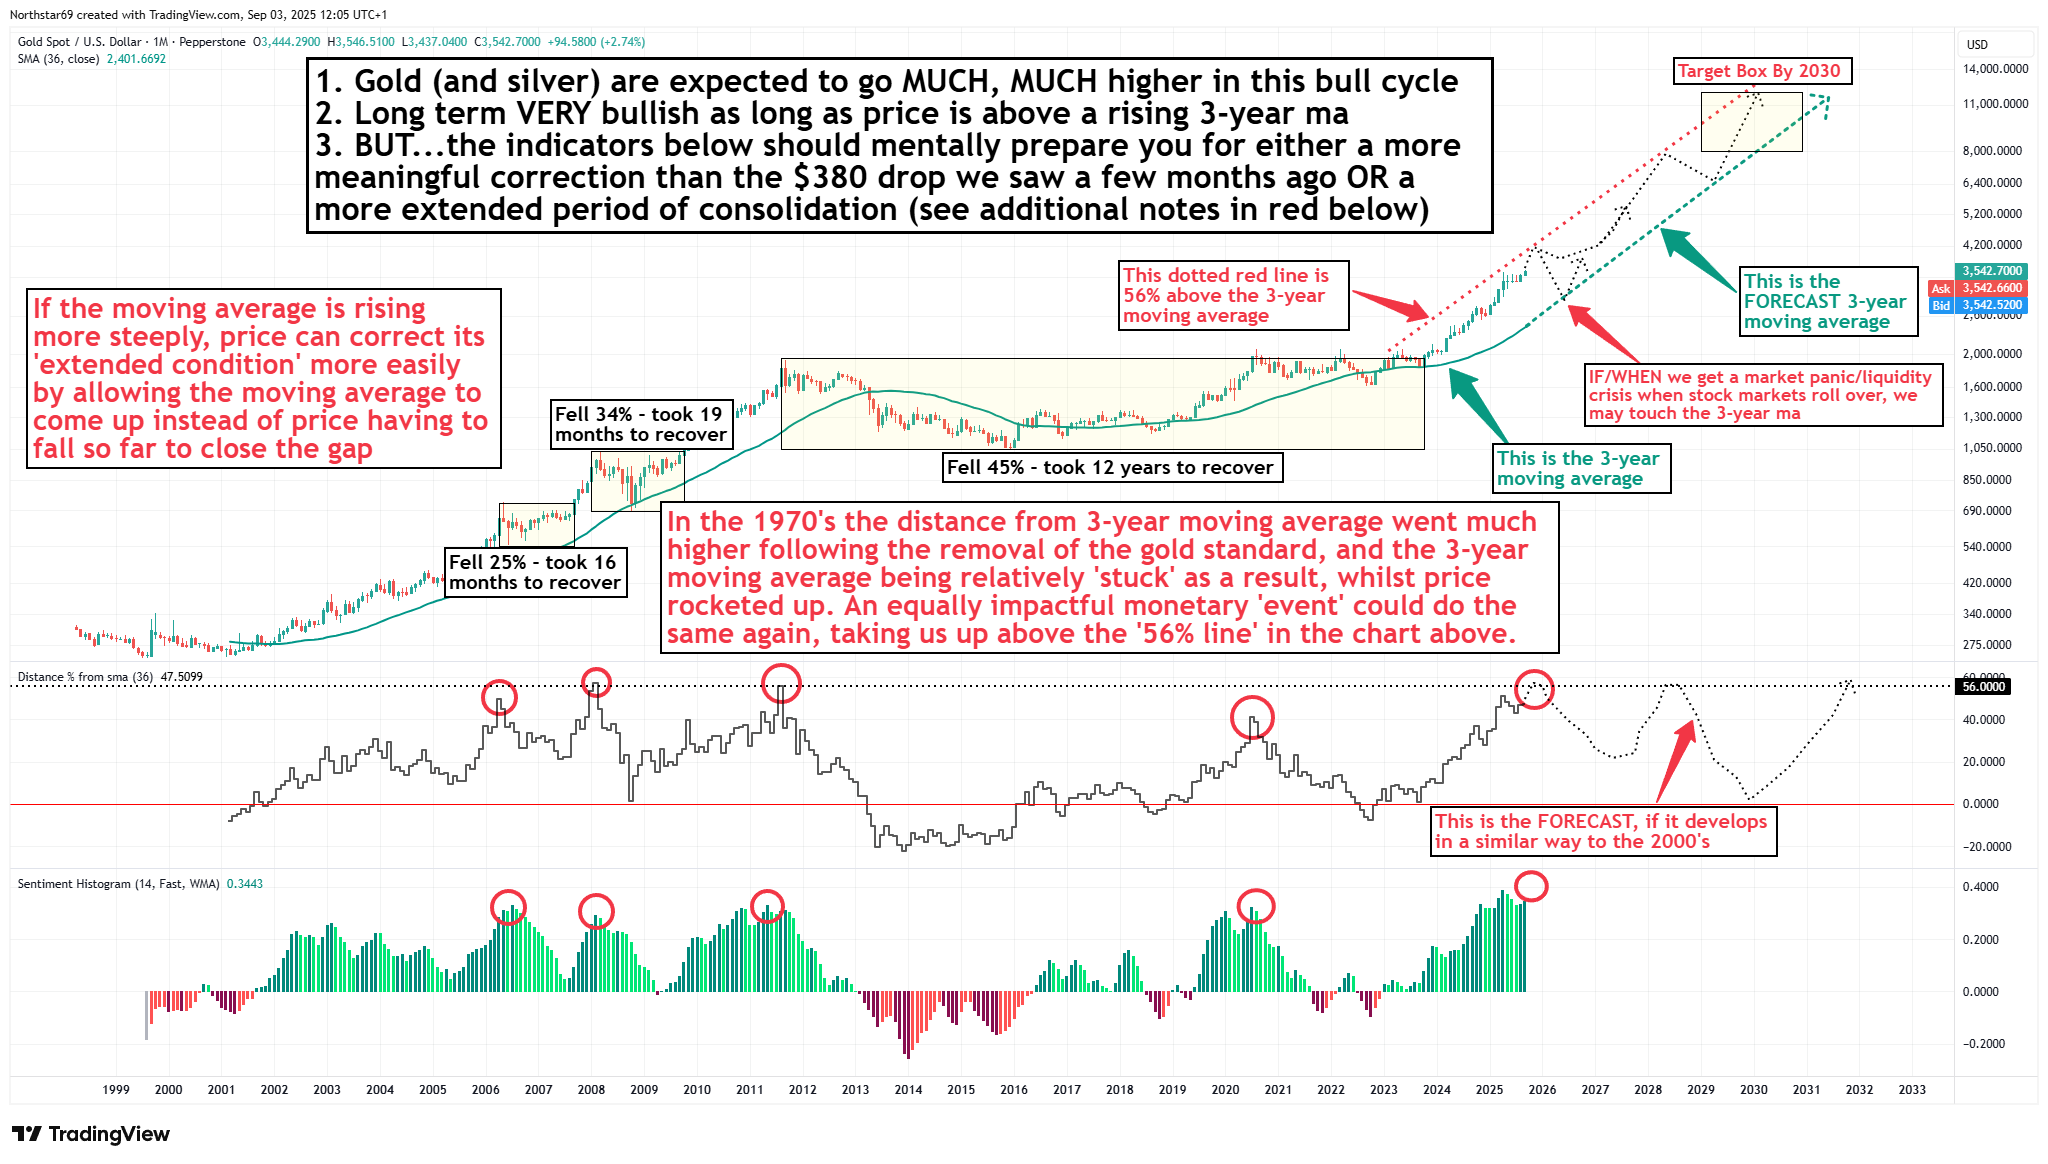
VIII. What does technical analysis suggest?
I am a subscriber to Northstar & Badcharts, and I previously introduced these guys in this article: “CAPITAL ROTATION – A visual article of X posts and charts from the guys at Northstarbadcharts.com.”
They also post a lot of their charts on X (https://x.com/NorthstarCharts and https://x.com/badcharts1) for free. Here is their Gold Roadmap Chart with Technical Analysis:
IX. What does The X Project Guy have to say?
The reason for this article now is my discretionary investment account, based on the investment themes I have been advocating in The X Project articles, was up 5% on Friday, closing at yet another new all-time high. I decided to look back to see how well I’ve done, and I am very pleased to see my account is up:
+67% since the beginning of the year
~+120% over the past 12 months
~+250% over the past 2 years
~+385% in my open positions that I started accumulating in April of 2022
Gold (OUNZ) is by far my most prominent position, representing 74% of my portfolio, which is up 86% on my open position and holds the #1 spot in open P/L. It is gold and silver miners, however, that have really been propelling my portfolio lately. My portfolio consists of 105 tickers, and full disclosure - 50 of them have a negative P/L. Having said that, to give you an idea of what tickers are propelling my portfolio, these are my top five open positions in terms of P/L%:
Coeur Mining Inc (CDE) +477% (#3 in open P/L $)
Discovery Silver Corp (DSVSF) +425% (#7 in open P/L $)
Heliostar Metals Ltd (HSTXF) +424% (#9 in open P/L $)
MP Materials Corp (MP) +392% (#11 in open P/L $)
Note, this is a rare-earth metals mining and processing company
Gold Fields LTD (GFI) +325% (#2 in open P/L $)
Filling in the gaps for the top five tickers in open P/L dollars are:
#4 is Global X Uranium ETF (URA) +106%
#5 is Aris Mining Corp (ARMN) +259%
So, with these significant gains sitting in open positions in my account and with many out there saying gold is overdone, over-extended, over-bought, and overdue for a correction, it was time to ask these questions, which helped me conclude to sit tight.
X. Why should you care?
I sincerely hope that, over the past 128 articles and nearly two years, you have come to believe in the investment theses I have advocated for, and that you have sought professional investment advice to align with these beliefs, and that you, too, have similarly impressive results to show for it.
If not, the point of this article is that it’s not too late. We are in the opening innings of this move in precious metals. I believe in the reasoning and projections above, and I think gold prices will rise by at least 2-3 times current prices over the next five years, likely 4-5 times, and possibly even more.
One of the reasons I have so many tickers is that I believe there are miners out there whose price can rise 10x, 50x, and even 100x if gold prices rise like I think they will.
There is an old saying that you want to own gold and rent the miners. I don’t plan to sell my gold, and the reason I own OUNZ is that it allows me to take possession of the physical gold behind the fully allocated shares I own. I intend to do this, adding to the physical gold I already own and store in my own safe.
In a future article, perhaps next week, we’ll dive into thoughts on the rest of the investment themes to which I subscribe and some of the tactics to consider on how to play the future.
I’m sure you care, like I do, for the well-being of your family, friends, neighbors, and colleagues. And I’m sure, like me, many of those people you care about don’t understand and probably don’t care about economics, geopolitics, money, interest rates, debts, deficits, energy, commodities, demographics, & markets. However, I would appreciate it if you could share my articles that curate, summarize, distill, and synthesize knowledge & learning at the intersection of these topics to help me reach more people and expand my audience, helping people know what they need to know. Things are going to get messy and more stressful soon.
Please note that this is not investment advice or a recommendation to buy or sell securities or investment products. Everything written and said is for informational purposes only, and you should do your own research and due diligence. It is recommended that you consult with an investment advisor before making any investments or changes to your investments based on the information provided by The X Project.
Thank you for your subscription, especially if you are a paying subscriber. Your support is everything to The X Project and is greatly appreciated. If you agree, please take a moment to hit the like button and share your positive comments about my articles, assuming you have something constructive to say.