In this 14-minute article, The X Project will answer these questions:
I. Why this article now?
II. What has gold’s price been doing?
III. What has China been doing?
IV. What have other central banks been doing?
V. What have U.S. investors been doing?
VI. What’s happening with gold miners?
VII. What does long-term technical analysis say?
VIII. What about short-term technical analysis?
IX. What does The X Project Guy have to say?
X. Why should you care?
Reminder for readers and listeners: nothing The X Project writes or says should be considered investment advice or recommendations to buy or sell securities or investment products. Everything written and said is for informational purposes only, and you should do your own research and due diligence. It would be best to discuss with an investment advisor before making any investments or changes to your investments based on any information provided by The X Project.
I. Why this article now?
Gold is an important topic that The X Project covers periodically, and the following are the prior articles:
Gold Prices are at New All Time Highs - Why now? And what does it possibly mean?
Priced in Gold – Looking at Inflation, the Dollar, and the World from a Different Perspective
It has been a couple of months since the last article, so it is time for an update. Since the last article above, gold was the topic of a section in each of the following articles:
Notwithstanding those two more recent articles, this article contains recent relevant news, analysis, and other thoughts worth sharing, starting with new all-time high prices once again! Notwithstanding, if you have not read the prior articles cited above, you should do so, as each contains important information worth knowing.
II. What has gold’s price been doing?
Here is a six-month daily chart of gold prices in U.S. Dollars:
Gold prices broke out to a new all-time daily closing high of $2,083.40 back on March 1, 2024, and the third article cited above was published at the end of the following week. On April 19th, gold posted its prior highest daily closing price at $2,391.80. It then retreated by $100 over the next week and a half to $2,291.30 on April 30th. After consolidating for about a week, the gold price rose again and closed Friday at $2,414.30, a new daily and weekly all-time high closing price.
How about gold priced in other currencies? According to goldprice.org, here is a table of the annual percentage change of the price of gold in U.S. Dollars, Australian dollar, Canadian dollar, Swiss franc, Chinese yuan, Eurodollar, British pound, Indian rupee, and Japanese yen (in order from left to right if you are unfamiliar with the currency abbreviations):
This table shows that gold prices are going up in every major currency. Or rather, the value of every major fiat currency, including the U.S. Dollar, is declining by large percentages relative to gold.
III. What has China been doing?
Here is what a Google search shows for “news about Chinese gold buying”:
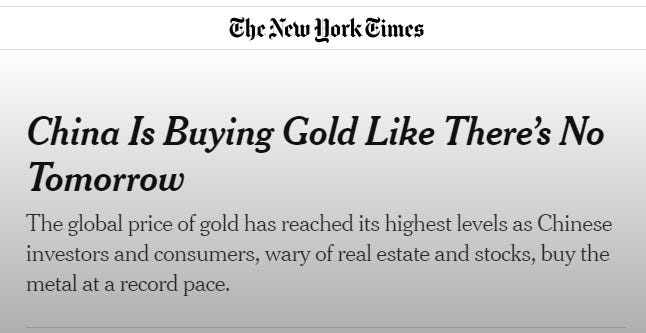
Those headlines pretty much say it all. But the recent New York Times article was particularly interesting as per the emphasis added in the following quote:
“Beijing is buying up gold to diversify its reserve funds and reduce its dependence on the U.S. dollar, long considered the most important currency to hold in reserve. China has been reducing its U.S. Treasury holdings for more than a decade. As of March, China had about $775 billion worth of U.S. debt, down from about $1.1 trillion in 2021.
When China increased its gold holdings in the past, it bought domestically using renminbi, said Guan Tao, global chief economist at BOC International in Beijing. But this time, he said, the bank is using foreign currencies to buy gold — effectively reducing its exposure to the U.S. dollar and other currencies.
Many central banks, including China, started acquiring gold after the U.S. Treasury Department took the rare step of freezing Russia’s dollar holdings under sanctions imposed on Moscow. Other American allies imposed similar restrictions for their currencies.
Mr. Guan said the sanctions had shaken the “foundation of trust for the current international monetary system” and forced central banks to protect their reserves with more diverse holdings. “We can see this wave of gold’s rise may be different from the past,” he said.”
Right on cue, this Bloomberg chart started circulating on X/Twitter earlier this week:
IV. What have other central banks been doing?
Hat tip to Luke Gromen from his latest Tree Rings report for the following charts. For the first quarter of 2024, total central bank purchases of gold were a record for any year and the fourth largest of any quarter.
This chart shows the historical total global gold reserves:
Luke notes: “In the late 1990s, global Central Banks were selling gold in response to the strong USD (red arrow), but global Central Banks have bought gold for the entire duration of the post-2014 strong USD (green arrow).”
V. What have global investors been doing?
According to the World Gold Council’s “Gold ETF Flows: April 2024” report with the subtitle “Europe drove outflows in April,” published May 8, here are the highlights as quoted from the article:
“Global gold ETFs saw a continuation of monthly outflows, despite early-April inflows spurred by the gold price strength.
Asia led global inflows and North American funds registered positive demand; but these were dwarfed by European outflows.
End April saw global gold ETF holdings fall to 3,079t, the lowest since February 2020. But the higher gold price in the month extended total AUM by 3% to US$229bn.
Gold ETF trading volumes increased across all regions, with a surge in North America, indicating continued investor interest despite outflows.”
And here are two charts from the article, first the longer-term view:
And a shorter-term view:
Why is there an outflow of gold from global ETFs (as per the first bullet in the highlights and the charts above) if gold prices are rising? Gold has traditionally and historically done well when interest rates were low or falling and not so well when interest rates were high and rising. There is a cost to owning and storing gold, an asset with no yield, and an opportunity cost versus other yielding assets. And so when interest rates are high, the opportunity cost of owning gold is high - meaning the alternative of selling gold and putting that money into money markets or short-term Treasury bills is attractive. Therefore, Western investors, in particular, are dutifully selling gold assets in favor of higher-yielding assets. Many gold enthusiasts claim that gold is historically under-invested and under-owned, a contrarian reason for being a buyer and owner today.
But wait a second. Interest rates have been rising in recent years and are now relatively high, yet gold prices have reached all-time highs despite the historical relationship just mentioned. Why is that? We’ll get to that in the final section of this article.
VI. What’s happening with gold miners?
While Gold has broken out to new all-time highs, gold miners still have a long way to go. The primary reasons are tied to the expectations above that gold should not be doing well in a high-interest-rate environment and that historically, gold miners have short periods of outperformance and otherwise underperform the market. That leaves gold miner equities undervalued and underinvested, setting up a perfect generational opportunity.
There is much more to be said about miners, but we’ll just set some context by looking at charts for this article. Here is the one-year daily chart of the VanEck Gold Miners ETF (GDX):
Here is the monthly chart going back eighteen years to the ETF’s inception in 2006:
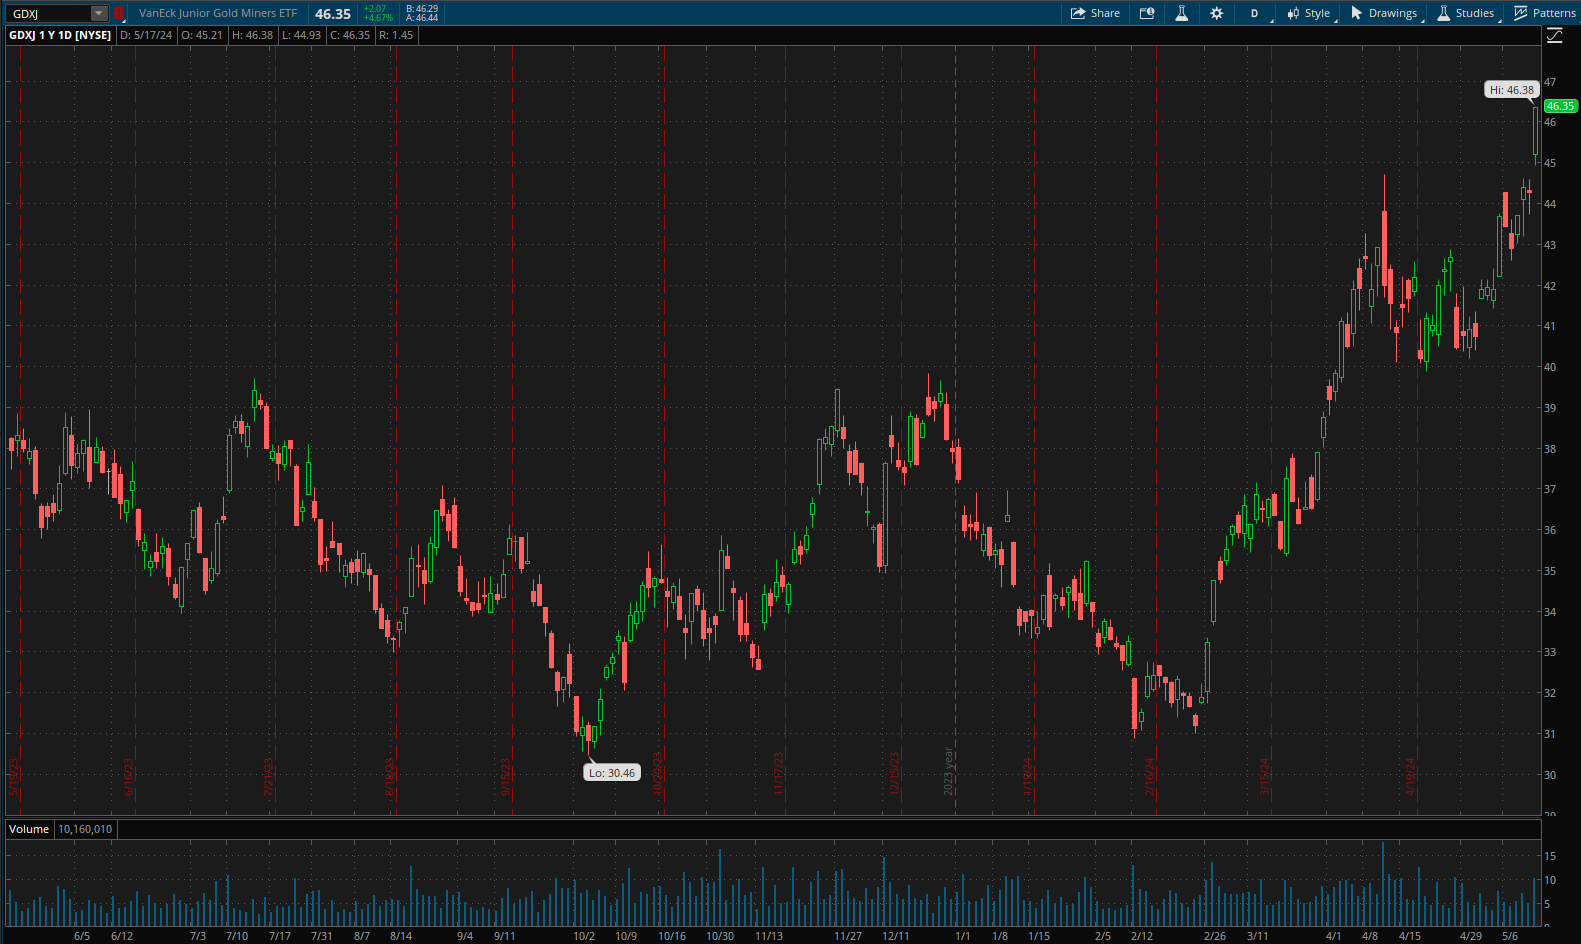
Here is the one-year daily chart of the VanEck Junior Gold Miners ETF (GDXJ):
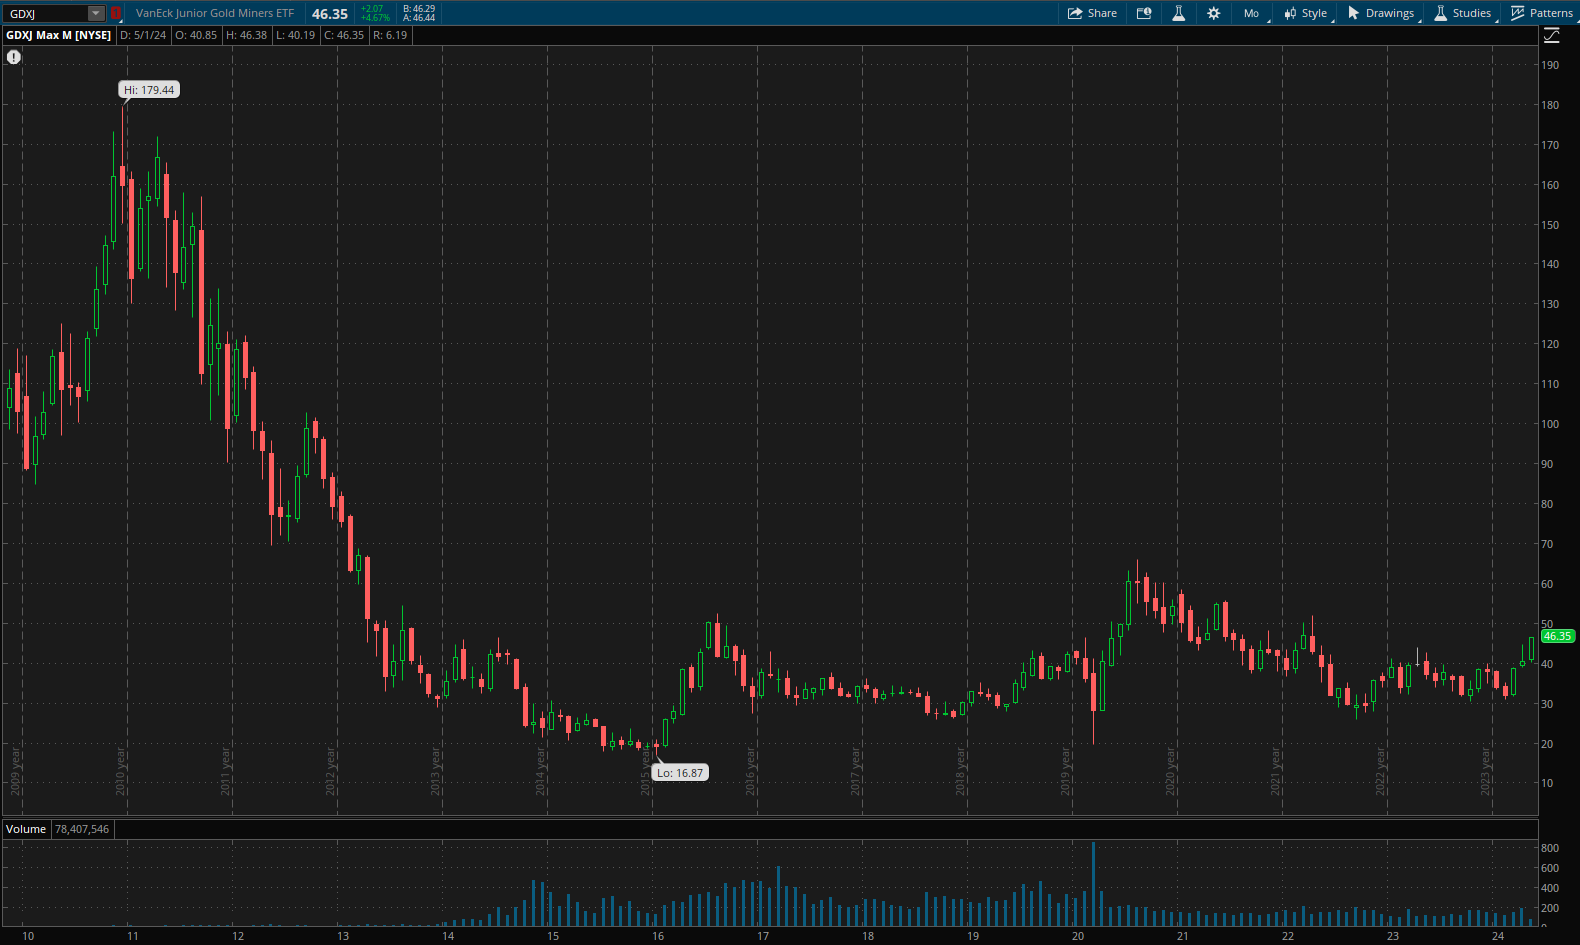
Here is the monthly chart going back fifteen years to the ETF’s inception in 2009:
VII. What does long-term technical analysis say?
I recently became a paid subscriber to northstarbadcharts.com after discovering them on X/Twitter and reviewing their prior analysis, and market calls over the past three years. They produce excellent charts with a lot of information that speaks for themselves. Here is the long-term 5-year Roadmap for gold, and I suggest taking some time to look at this chart and its details carefully.
The next section will examine the short-term technical analysis of gold. In Section IX, I will tell you what I think. Then, in Section X, why should you care and, more importantly, what more can you do about it. However, I have just hit a new paid subscriber threshold, so you must now be a paid subscriber to view the last three sections. The X Project’s articles always have ten sections. Soon, after a few more articles, the paywall will move up again within the article so that only paid subscribers will see the last four sections, or rather, free subscribers will only see the first six sections. I will be moving the paywall up every few weeks, so ultimately, free subscribers will only see the first four or five sections of each article. Please consider a paid subscription.
Also, podcasts of the full articles narrated are available only to paid subscribers.
All paid subscriptions come with a free 14-day trial; you can cancel anytime. Every month, for the cost of two cups of coffee, The X Project will deliver two articles per week ($1.15 per article), helping you know in a couple of hours of your time per month what you need to know about our changing world at the interseXion of commodities, demographics, economics, energy, geopolitics, government debt & deficits, interest rates, markets, and money.
You can also earn free paid subscription months by referring your friends. If your referrals sign up for a FREE subscription, you get one month of free paid subscription for one referral, six months of free paid subscription for three referrals, and twelve months of free paid subscription for five referrals. Please refer your friends!
VIII. What about short-term technical analysis?
Here are some excerpts from northstarbadcharts.com’s post on Friday regarding realistic short-term expectations for gold:
“By looking at the bigger picture, and then zooming into smaller timeframes, we can use multiple, unbiased techniques to arrive at sensible targets. As time goes by, we need to constantly update those targets, based on new price action evidence.
There are a number of methods that point towards the $2700 region for gold and $35-$40 for silver. These are my latest thoughts, starting with gold. Below, you’ll see the big picture, monthly chart.”
“Here, I’ve used fib extensions, measured moves (blue arrows) and distance from ma to arrive at a figure of $2660. The blue arrow measured move fits well if you use the starting point of the bounce off the 3-year ma (red circle). I’ve estimated the future path of the 3-year ma (dotted green line), and measured 36% above that. Now let’s look at the daily chart. It’s this timeframe that will tell us when to step aside for a while (unless you’re simply stacking, with an eye on the big prize, and unconcerned by a possible large correction first).”
“After yesterdays post, we broke out and now have our next red uptrend support line on the distance from ma indicator. When that breaks down, we have our loss of momentum signal. If the indicator reaches similar levels to last time, we could have a 4-5 week uptrend. What I find intriguing is that although the red line on the price chart takes us to $2800, if we run out of road on the indicator by the end of June, the breakdown would be likely to occur in the $2660 region! Before the breakdown occurs, a peak in the $2700-$2800 area is entirely possible.”
IX. What does The X Project Guy have to say?
Do you own enough gold? Whenever I research, study, read, and write about gold, I want to own more and usually buy more. On the one hand, this has been working out well as the price (in U.S. Dollars) continues to rise, and the outlook is convincing for even much higher gold prices.
What about the other hand? As Doomberg has said repeatedly, gold is the one asset he owns that he dislikes seeing go up. Huh? He means that gold is not an investment to him but rather his way of accumulating savings in a store of value. The price of gold is a constant and has been throughout history. It is not the price of gold that is at an all-time high, but rather the price of the U.S. Dollar that is falling to new all-time lows. As I've discussed in many articles, that is not good.
X. Why should you care?
In Section V above, I said, “Interest rates have been rising in recent years and are now relatively high, yet gold prices have reached all-time highs despite the historical relationship just mentioned. Why is that?”
The popular, mainstream answer is that gold prices are hitting new all-time highs because investors expect interest rates to start coming down soon. That might be partially true, but that contradicts the fact that investors have been net sellers of gold ETFs. Furthermore, the Fed raised rates 525 basis points between March 2022 and July 2023. What did gold prices do during that time frame? Down, up, and back to where it started. Gold was priced at $1,924 at the end of March 2022 and $1,941 at the end of July 2023. That fact confirms one of the primary theses of The X Project: we are in a whole new and very different world than the one in which we grew up.
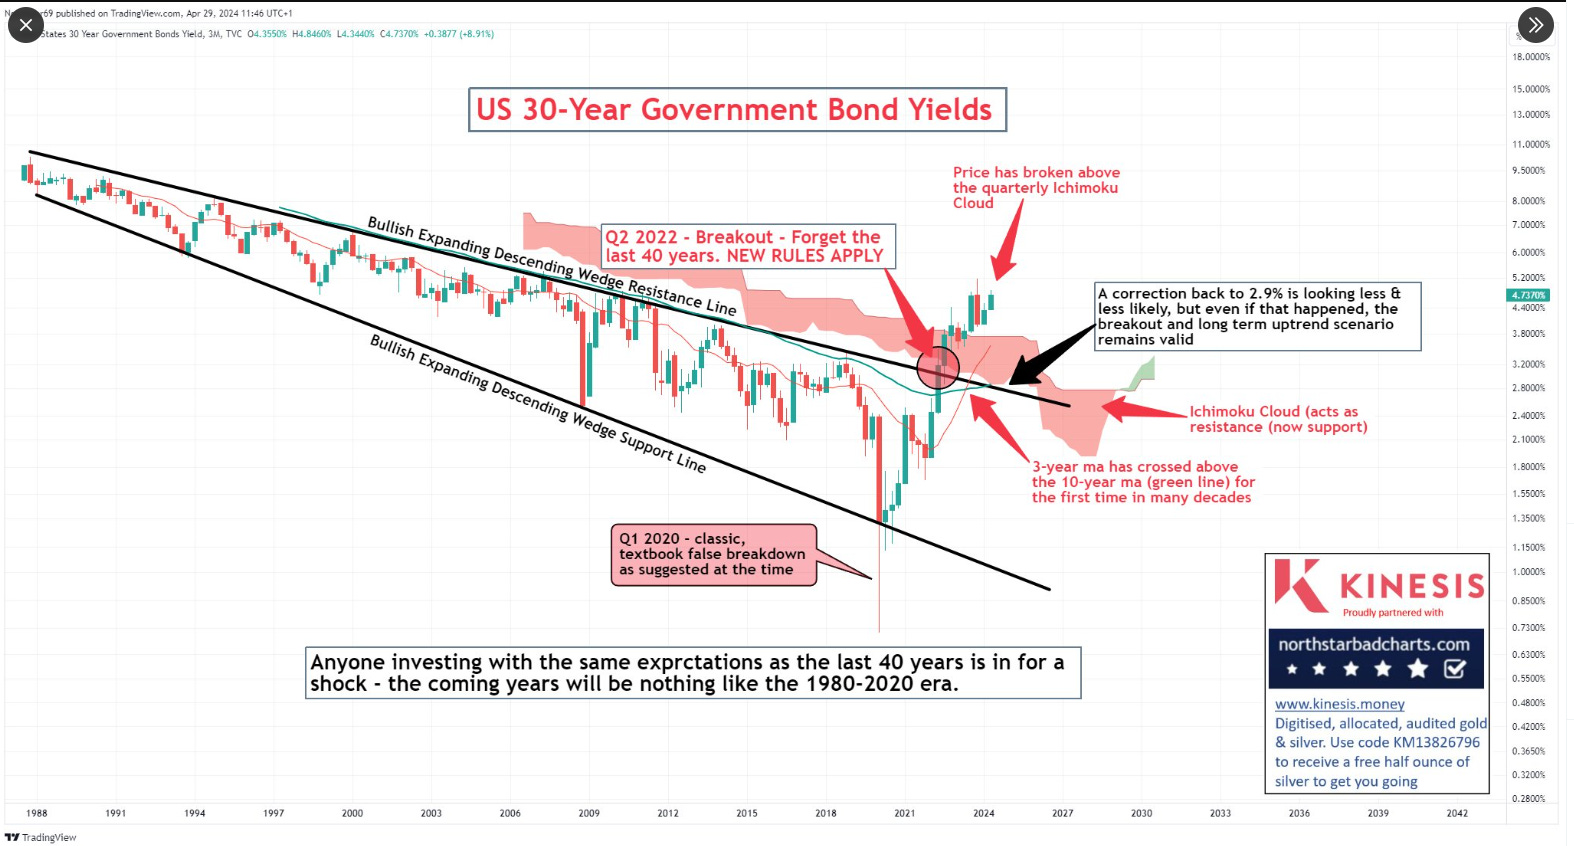
To further highlight this point from a different but related perspective, I will turn once again to northstarbadcharts.com:
I agree with the conclusion of this long-term analysis of the U.S. 30-year government bond yields: “Anyone investing with the same expectations as the last 40 years is in for a shock - the coming years will be nothing like the 1980 - 2020 era.”
The price action in the gold market is sending the same message. You can go to prior articles to see the ten investing themes to which The X Project subscribes as a result of this thesis.
Lastly, regarding the cadence of articles published by The X Project, I have been publishing two articles per week on Wednesdays and Sundays. In an effort to ensure the highest quality and most relevant content to my subscribers, I am going to slightly reduce the cadence so that going forward, articles will be published every other Wednesday and will continue to be published each Sunday. Therefore, the next article will be published next Sunday, May 26th.
Thank you for your paid subscription. Your support is everything to The X Project and is greatly appreciated. If you agree, please do me the favor of hitting the like button and posting positive comments about my articles - assuming you have positive things to say - especially about these final sections (soon to be more sections) that only you as a paid subscriber get to see.


